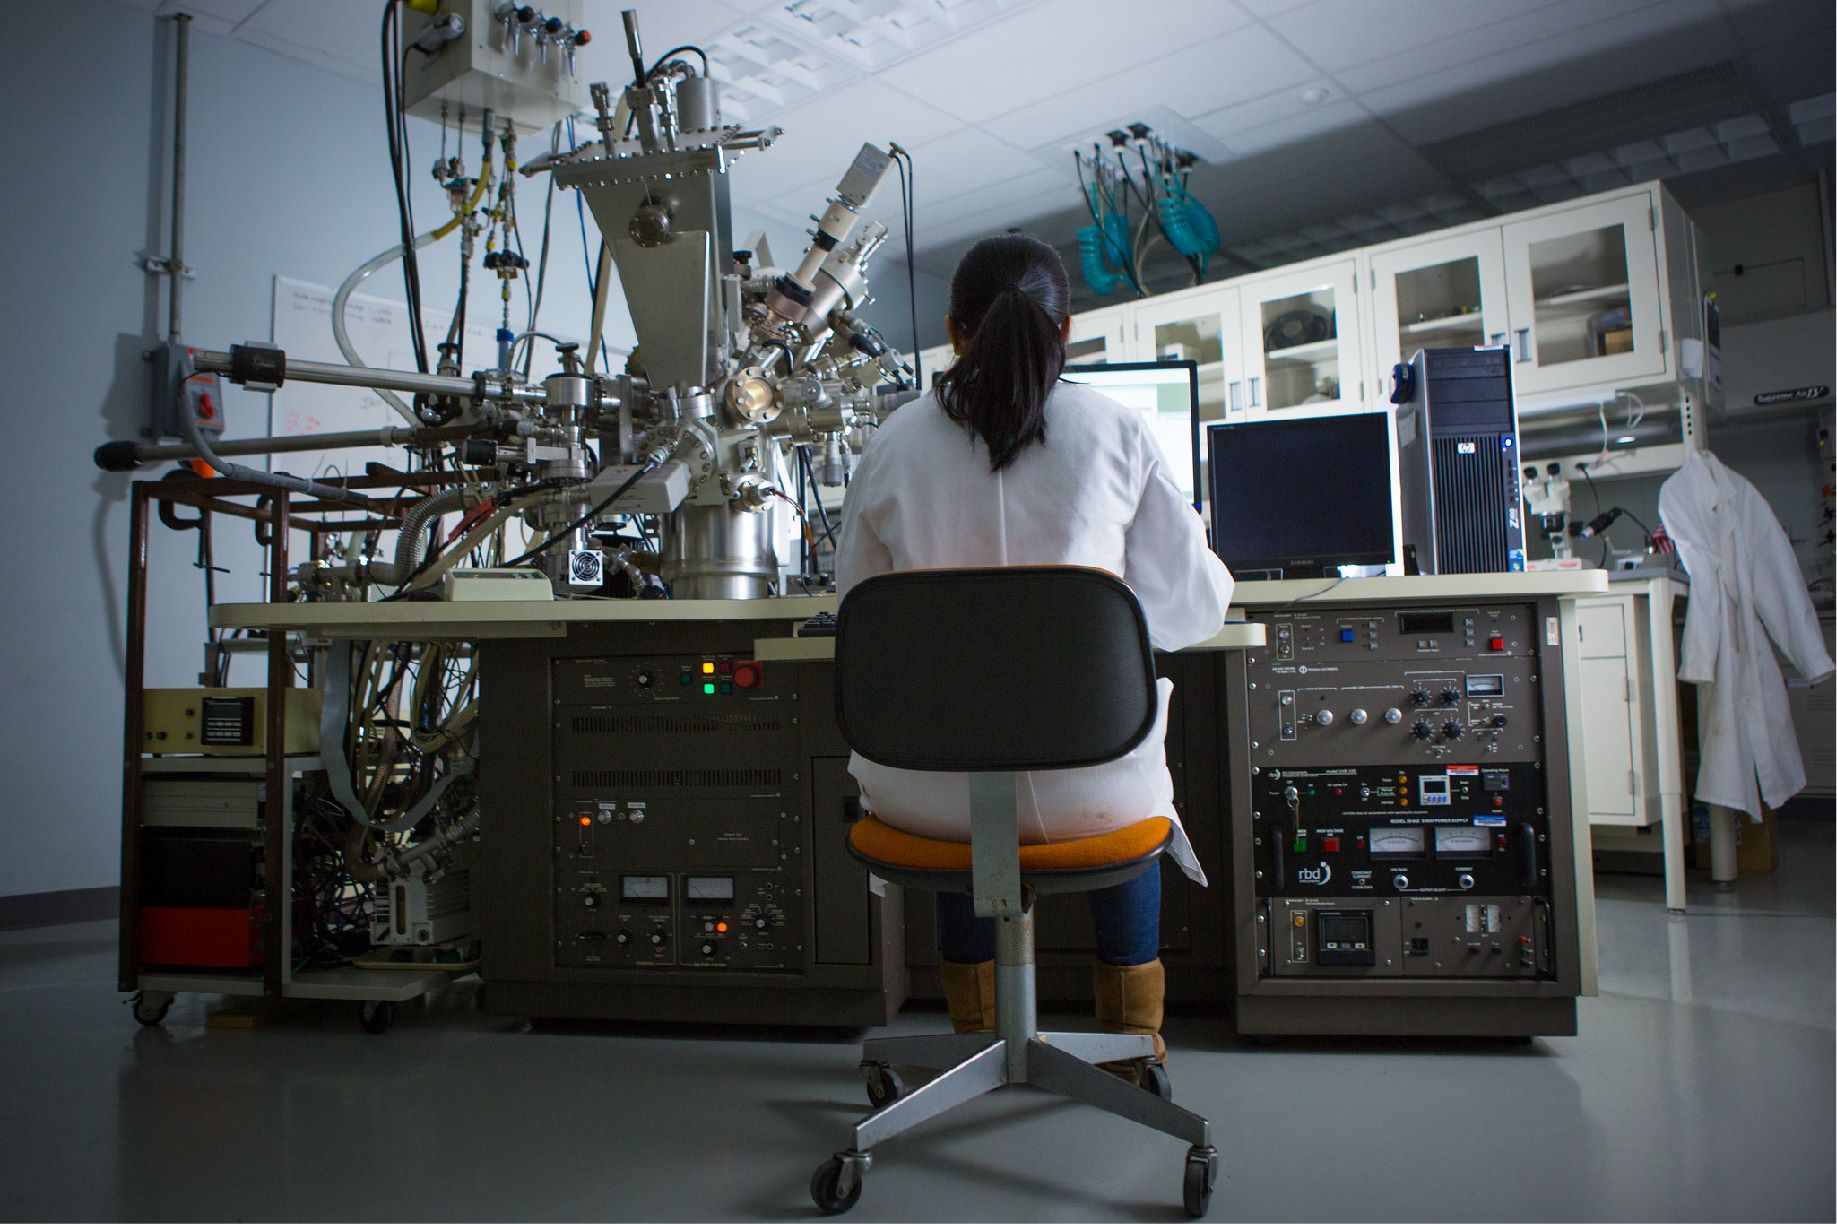
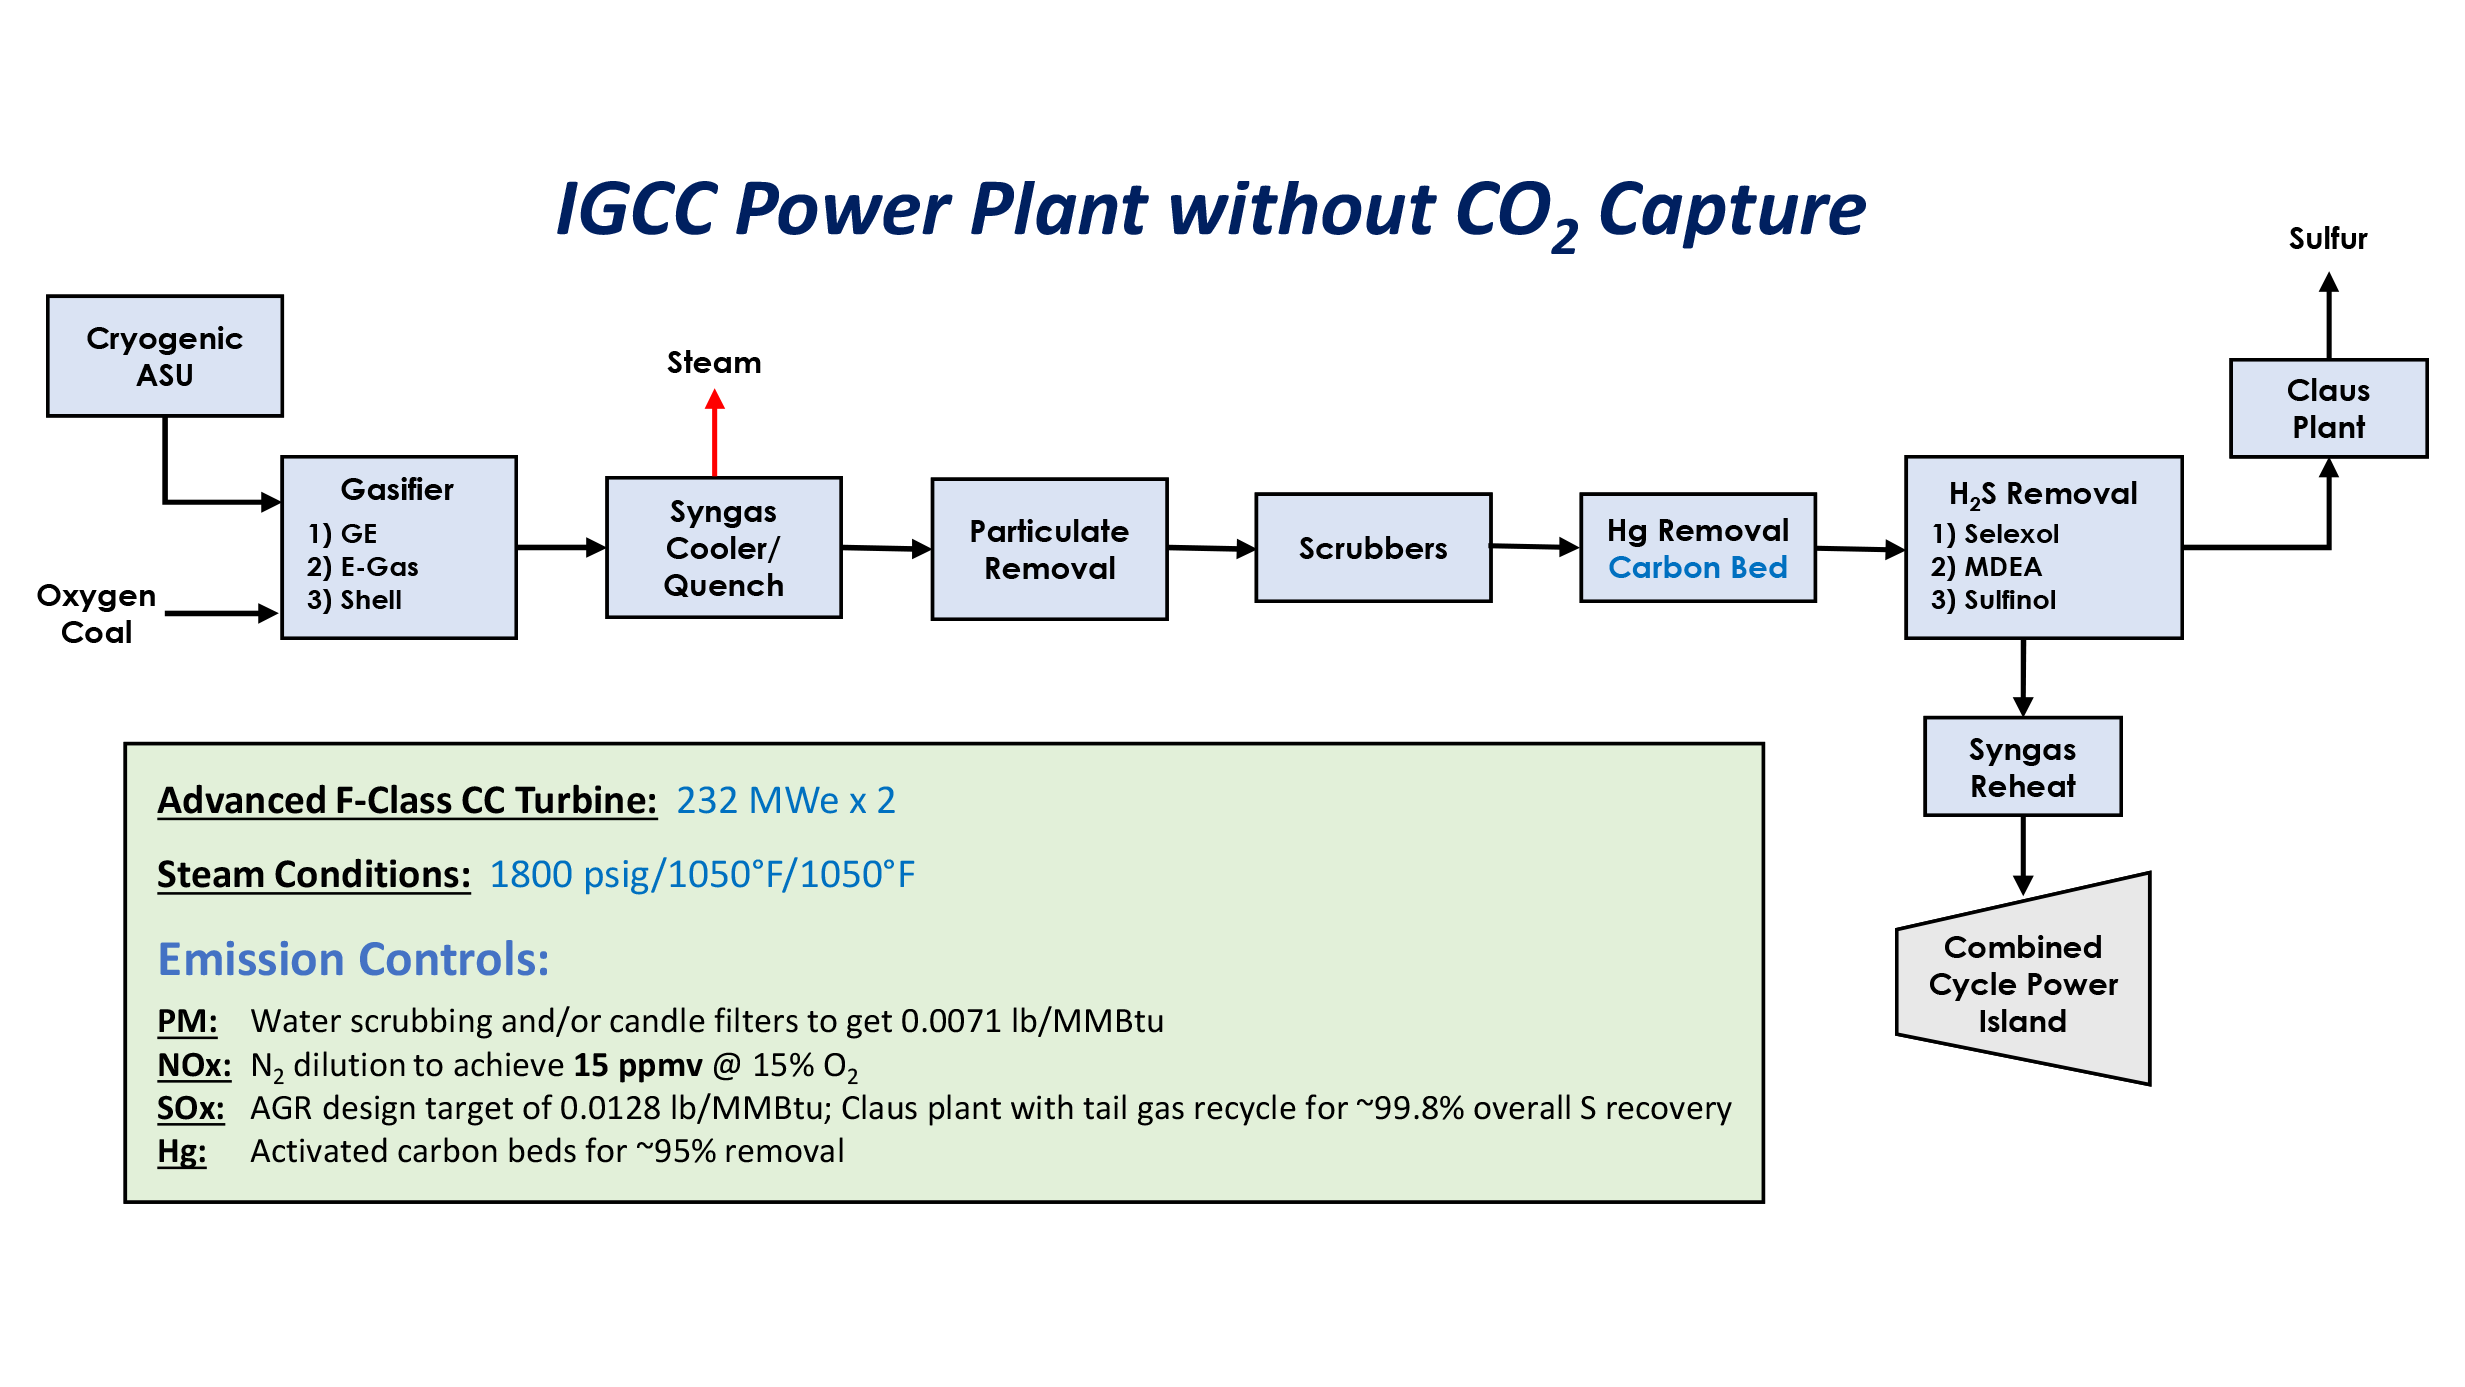
Consideration of efficiency and relative performance of current technology-based integrated gasification combined cycles (IGCC) has been made by NETL in ongoing studies.1 These include IGCC power plants based upon a commercially available gasification technologies, as depicted in Figure 1.
Figure 1
On these bases, estimated net efficiencies for near-term high efficiency ~625 MW-size (non-CC) integrated gasification combined cycle (IGCC) power plants, designed for Illinois No. 6 coal feed, without carbon dioxide (CO2) capture, range from:1
39.9% higher heating value (HHV) basis for the GE Energy radiant gasification-based IGCC;
41.1% (HHV) for the E-Gas™ two-stage gasification-based IGCC;
43.0% (HHV) for the Shell dry-feed gasification-based IGCC.
These illustrate the relative IGCC efficiency advantage among the three gasification technologies. Because the dry-feed technology eliminates the need to vaporize water in the gasifier, the Shell-based IGCC is more efficient than the two slurry-feed GE and E-Gas™-based IGCC. Considering the slurry-feed GE and E-Gas™-based IGCC cycles, the 2-stage E-Gas™ technology is more efficient because of its lower operating temperature, as measured by the gasifier syngas exit temperature.
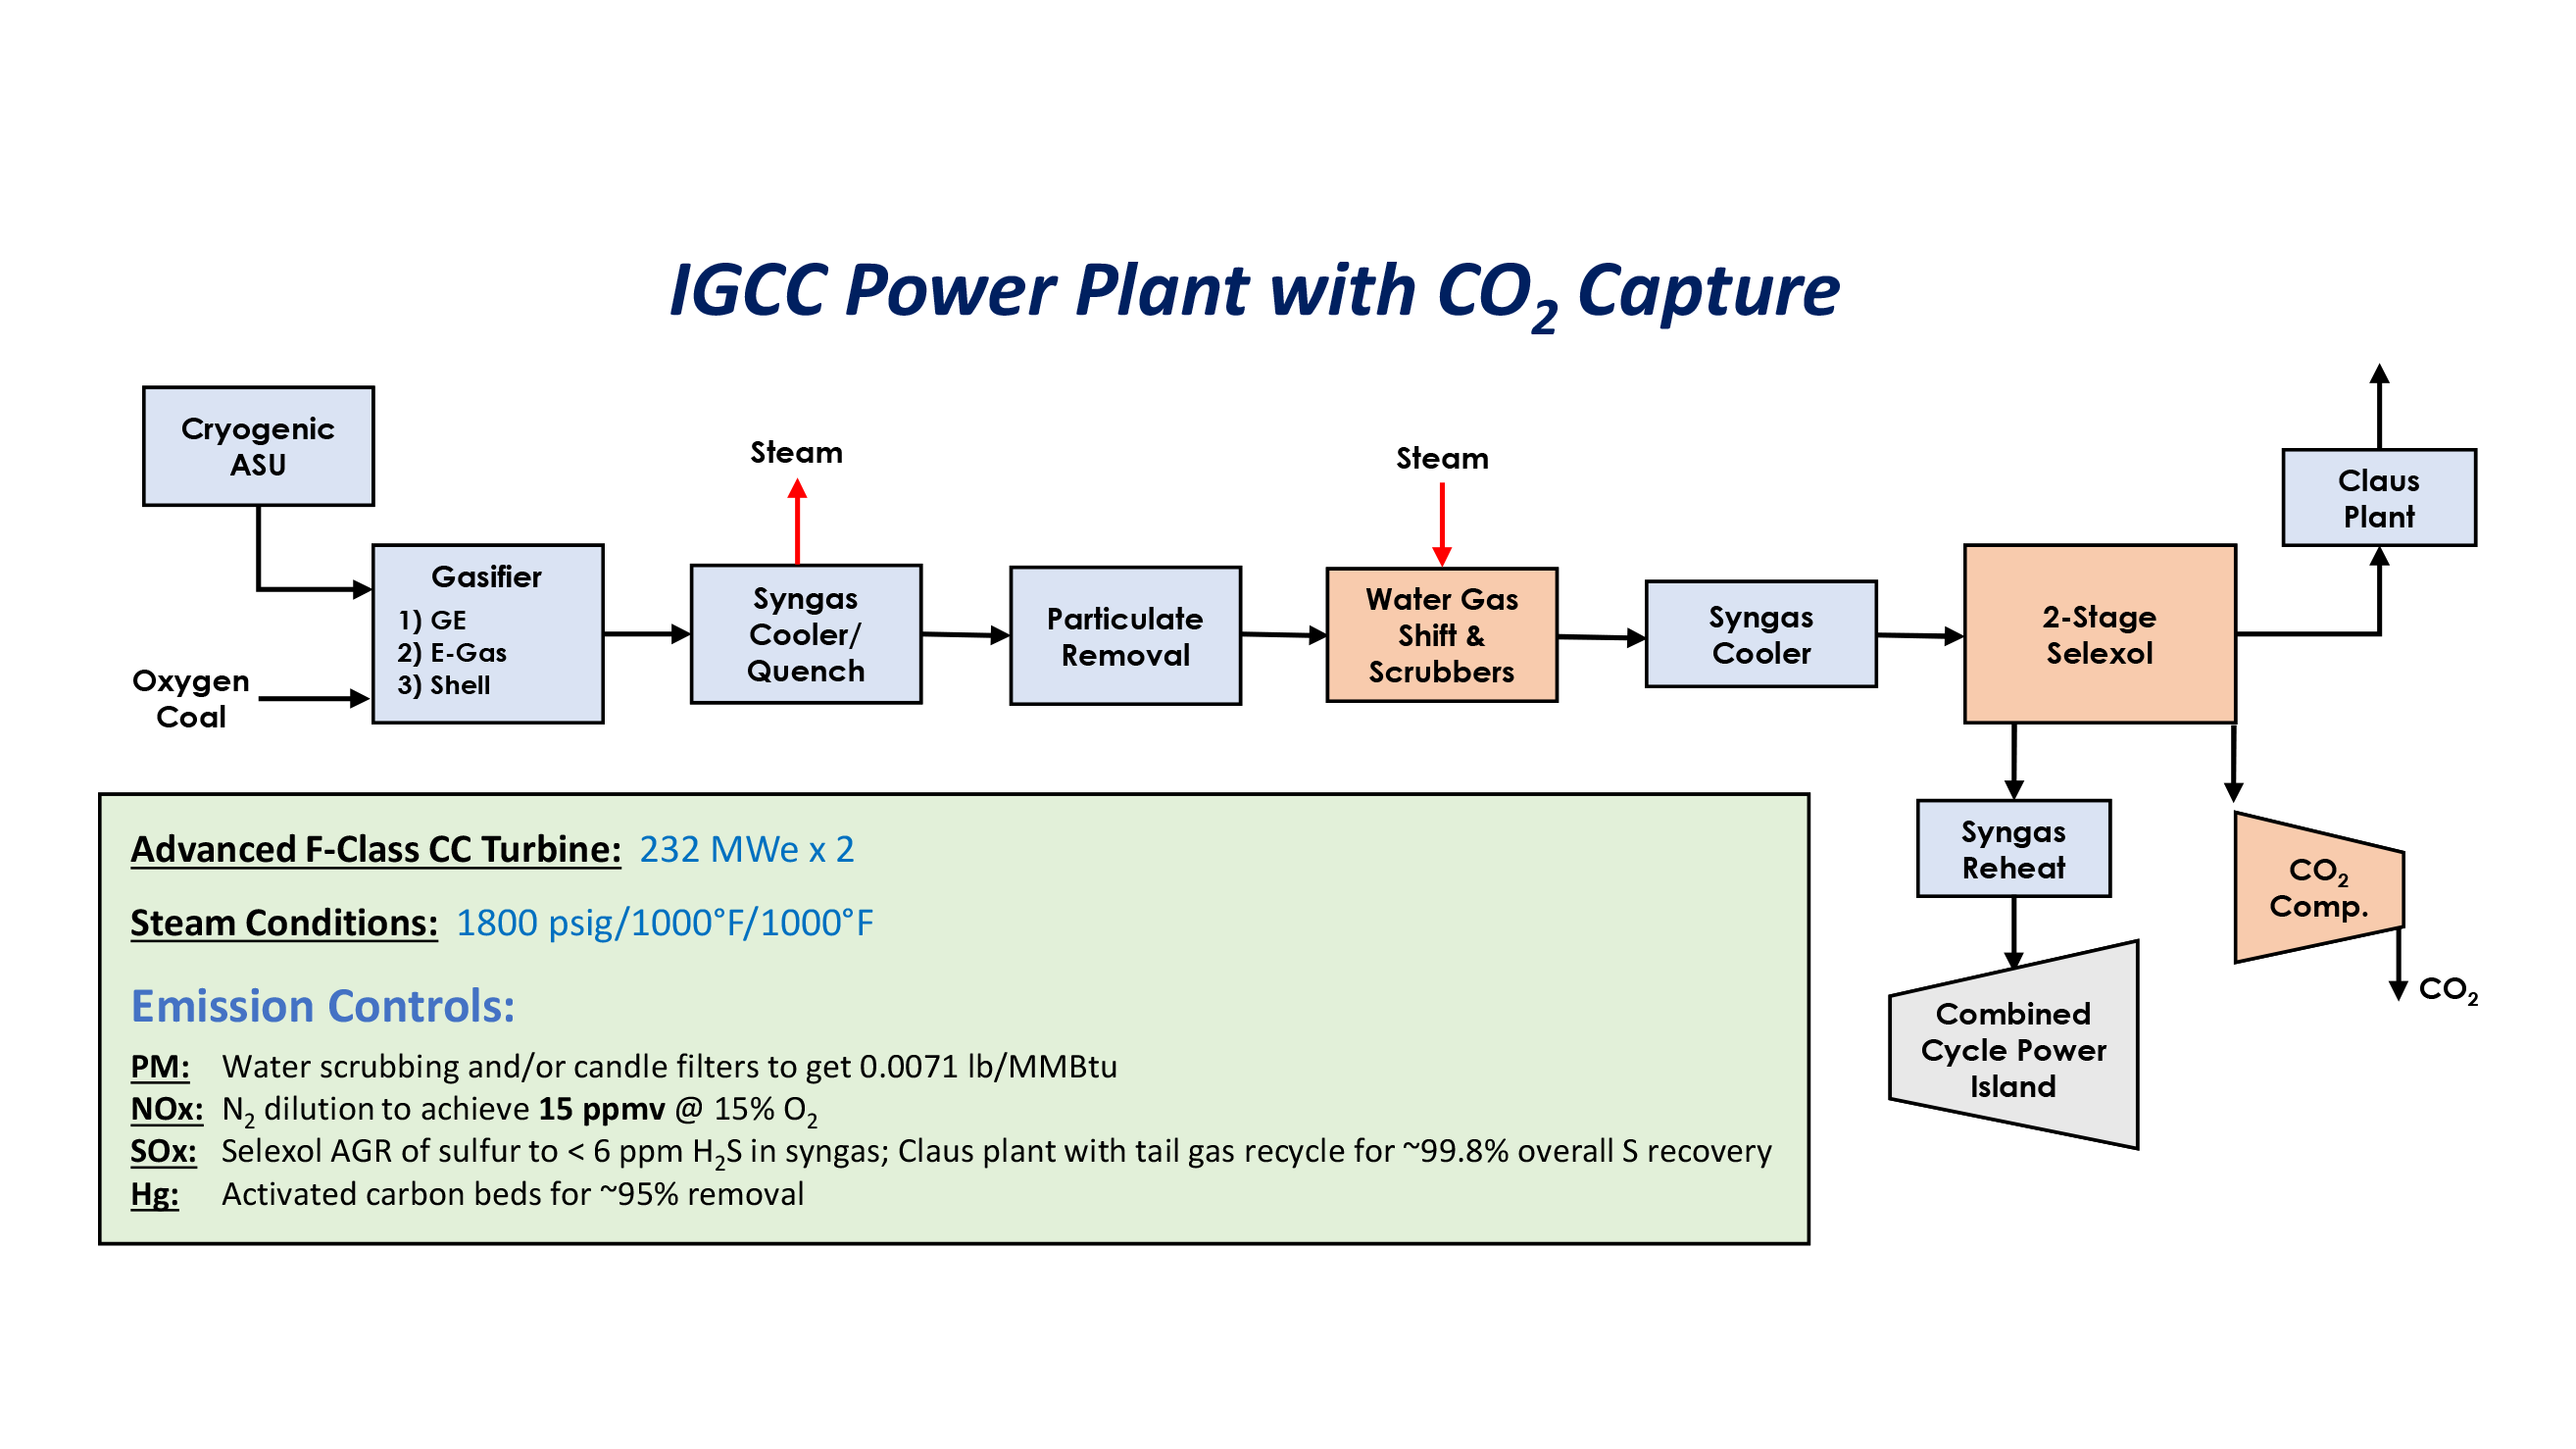
IGCC plants corresponding to the foregoing, but including carbon capture, are as depicted in Figure 2.
Figure 2.
Corresponding cycle efficiencies are as follows:
33.7% (HHV) for the GE radiant gasification-based IGCC with carbon capture;
30.2% (HHV) for the GE quench gasification-based IGCC with carbon capture;
33.8% (HHV) for the E-Gas™ two-stage gasification-based IGCC with carbon capture;
32.5% (HHV) for the Shell dry-feed gasification-based IGCC.
In the carbon capture cases, the relative efficiencies observed in the non-capture cases are both lowered and skewed by the significant energy penalty associated with process modifications for 90% carbon capture. These accrue from loss of gross power generation because of increased amount of steam diverted for use in the Selexol process, rise in air separation unit (ASU) compression load without combustion turbine integration, and increases in auxiliary power for the gas cleanup/CO2 capture. Taken together, the energy penalties happen to be least for the GE Energy-based cycle and most for the Shell cycle. Overall, with carbon capture included, this causes overall efficiencies to be more nearly equal among the four gasifier type cycles.
Table 3 summarizes the main performance parameters for all the above, in terms of power, heat rate, and efficiencies.
Program
GE (radiant)
GE (quench
E-Gas
Shell
CO2 Capture
NO
YES
YES
NO
YES
NO
YES
Gross Power (MW)
765
741
685
742
742
765
696
Auxillary Power
Air Separation Unit
74.3
76.9
77.0
65.8
75.1
66.2
71.0
N2 Compression
25.6
36.6
36.6
25.8
36.9
32.5
36.3
AGR/CO2 Capture
3.0
11.6
11.6
3.2
11.7
0.7
11.3
CO2 Compression
-
31.7
31.7
-
31.9
-
31.0
BOP
28.2
28.1
28.8
27.6
29.2
26.1
27.2
Total Auxiliary Power (MW)
131
185
186
122
185
125
177
Net Power (MW)
634
556
499
641
557
640
519
Heat Rate (Btu/kWh)
8,554
10,118
11,287
8,308
10,101
7,940
10,497
Efficiency (HHV)
39.9
33.7
30.2
41.1
33.8
43.0
32.5
Energy Penalty*
-
6.2
9.7
-
7.3
-
10.5
* CO2 Capture Energy Penalty = Percent points decrease in net power plant efficiency due to CO2 capture.
Table 3: IGCC Performance Results.
Table 4 summarizes the economic results for the various IGCC cases, including plant capital costs, cost of electricity, and cost of avoided CO2.
Program
GE (radiant)
GE (quench
E-Gas
Shell
CO2 Capture
NO
YES
YES
NO
YES
NO
YES
Total Plant Cost, $/kWe (2018$)*
Gasifier & Auxiliaries
2,025
2,300
1,629
1,673
1,943
2,134
2,904
Air Separation Unit
446
519
578
410
511
412
529
Turbines & HRSG
514
565
600
489
561
489
578
AGR/CO2 Capture
346
1,264
1,296
336
1,571
319
1,575
BOP
776
921
1,110
749
915
734
960
Total
4,105
5,568
5,212
3,656
5,501
4,087
6,545
COE, $/MWh (2018$)
Capital
58.6
79.8
74.8
52.1
79.0
58.2
93.7
Fixed
21.4
28.7
27.3
19.2
28.4
21.3
33.5
Variable
14.9
20.3
19.8
13.3
20.3
14.3
23.2
Fuel
19.0
22.5
25.1
18.5
22.5
17.7
23.4
CO2 TS&M
-
8.1
9.1
-
8.2
-
8.6
Total†
114.0
159.4
156.2
103.2
158.3
111.5
182.3
Cost of CO2 Avoided, $/tonne (2018$)
-
137.9
135.3
-
136.6
-
172.8
* Total Plant Capital Cost (Includes contingencies and engineering fees but not owner's costs)
† 280% Capacity Factor