Business

Business
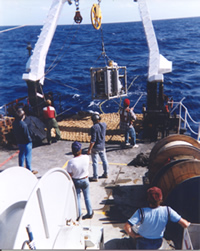
During February 14-18, 2005, a scientific cruise was conducted using the R/V Pelican to obtain high-resolution sidescan sonar and multibeam bathymetric data of Mounds D and F in the Atwater Valley area of the Gulf of Mexico, to better characterize sites selected for experimental drilling by the ChevronTexaco Gas Hydrates Joint Industry Project (JIP).
Naval Research Lab – Dr. Joan Gardner
Location
Washington, DC 20375
Atwater Valley, Gulf of Mexico
During May, 2004 the Naval Research Lab (NRL) collected piston cores and thermal profiles, as well as bottom camera and electromagnetic data, along a transect between Mounds D and F, in Atwater Valley blocks 13 and 14, in the Gulf of Mexico, using the R/V Gyre. NRL used U.S. Geological Survey seismic line AV65 to guide their sampling operations, and they found significant temperature anomalies associated with the mounds, with thermal gradients locally up to 150-200 degrees C/km, suggesting unusually high fluid flux through the sedimentary column near the mounds. Preliminary geochemical analyses of 3-8 meter long piston cores collected along the transect indicated areas of high chloride concentration and no sulfate reduction zone, indicating areas of high methane flux.
The February 2005 R/V Pelican cruise was a follow-up to the May 2004 cruise. The objective was to collect additional geophysical data along the transect, specifically high-resolution sidescan sonar and multibeam bathymetric data. Prior bottom camera and electromagnetic data from the 2004 cruise were used to ground-truth the backscatter data. The integrated data show the shape of Mounds D and F in a series of high resolution seafloor maps.
The project resulted in three high resolution maps of Atwater Valley Mounds D and F in the GOM. These maps provided a site characterization and navigational aid to the ChevronTexaco JIP. JIP scientists used the maps to visualize the detailed shape of Mounds D and F, and they used this information to guide operations associated with drilling an exploratory well.
Results:
The cruise took place February 14-18th, 2005. A preliminary cruise report was submitted on March 15, 2005, and a final cruise report was submitted in November, 2005. The report includes a description and examples of the data collected, as well as backscatter maps of Mounds D and F in Atwater Valley.
Sidescan data were collected and laid over the three areas that the JIP was planning to drill in mosaic fashion. Several features were revealed. The top of Mound F is flanked by a series of curved faults and cracks which are slightly arcuate in shape. Additionally, there is a higher backscatter region on the southern flank of the mound that may be a small mud flow or vent site.
Between the mounds is a small network of faults that form wrinkles on the seafloor. These faults are very small (2-5 meters of throw) and show some signs of erosion by bottom current forces. There are a few dark patches in the image, possibly representing coral or clam communities.
Mound F contains an area of venting with mud flows. There are also several areas of sand/mud waves that are the result of area bottom water currents. In the southwest corner of the image there are a series of small faults. A JIP drill site had been provisionally positioned to the southeast of what appears to be a vent site near Mound F. As a result of this project a recommendation was made that consideration be given to moving the JIP site to lie within the zone of higher backscatter. Heat flow data were collected over this site on a previous cruise, and the data show high heat flow values in the region of high backscatter, which suggests fluid flow and venting.
Sub-seafloor information is poor. The sensor was confirmed to be performing within specifications, so the lack of definition in the sub-bottom image is most likely due to gas or fluids entrained in the sediments.
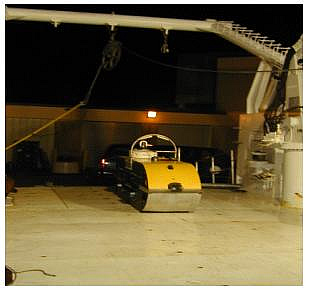
This project is completed. The scientific cruise on the R/V Pelican took place February 14-18th, 2005. NRL scientists collected sidescan sonar, bathymetric, and sub-bottom data with their DT1 instrument at Mounds D and F in Atwater Valley. The Final Report was submitted on November, 22, 2005, summarizing the backscatter and sub-bottom data. The report is available below under "Additional Information".
$26,000
$24,000
NETL - Frances Toro (frances.toro@netl.doe.gov or 304-285-4107)
NRL – Dr. Joan Gardner (gardner@qur.nrl.navy.mil or 202-404-1094)
In addition to the information provided here, a full listing of project related publications and presentations as well as a listing of funded students can be found in the Methane Hydrate Program Bibliography [PDF].
Final Cruise Report [PDF-9358KB] - November, 2005 - Naval Research Laboratory
Seismic Indications of Marine Hydrates
Seismic reflection surveys are the principal method for quickly assessing broad submarine areas for the presence of gas hydrates. A marine seismic survey is typically carried out from a ship that tows an energy (sound) source and a recording cable. The sea floor and the structures beneath it, are mapped by measuring the time it takes for a sound wave (or pulse) to leave the source, penetrate the earth, reflect off a subsurface layer, and return to a recording hydrophone on the cable. Reflections occur at each subsurface horizon where there is a measurable change in acoustic velocity (the speed at which sound is transmitted).
The energy transmitted in seismic surveys takes the form of compressional waves (P-waves) and shear waves (S-waves). As the P-wave moves through a substance the particles move back and forth in the same direction the wave is traveling (analogous to the compression and expansion of the coils in a Slinky toy spring). P-waves can travel through solids, liquids, or gases (e.g., sound waves are P-waves in air) and travel faster than S-waves. With the slower S-waves the particles move at right angles to the direction of the wave (analogous to the wave that moves along a rope when one end is oscillated). Because liquids and air have no shear strength, S-waves can only travel through solids. Marine seismic sound sources generate only P-waves, but some of the energy is converted to S-wave energy as the sound travels downward into the subsurface, encounters a sedimentary layer, and is reflected back as both P- and S-wave energy. Recording both reflections allows a better interpretation of the structure and the fluids present.
A Helmholtz resonator is used to generate seismic waves for the NRL deep-tow system. On the recording cables are pressure-sensitive receivers (hydrophones) that detect the instantaneous change in water pressure associated with the seismic signal. These cables can be designed to capture single channel or multichannel data. Single-channel seismic data (SCS) provide excellent images of hydrate/gas deposits but do not record seismic velocities. Multichannel seismic data (MCS), collected with multiple cables, can image structures and provide velocity information.
Marine seismic data can be collected in either two dimensions (2-D) or three dimensions (3-D). Seismic surveys in 2-D collect data along a single line of receivers. The result is a view of the subsurface as a two-dimensional slice of the earth directly below the geophones. However, because sound travels outward in all directions, features, structures, and irregularities not directly under the line also reflect sound, making accurate interpretations difficult. In contrast, 3-D seismic surveys use a grid of geophones that allows the entire wave field to be sampled. This design results in a cube of data that takes into account the different angles and distances of the reflected waves. Researchers then use computer work stations to view the subsurface along any plane desired.
Researchers are now developing ways to discern the presence, and also distribution, of hydrates from seismic data. This is possible because the presence of gas hydrates tends to strengthen the sediment, increasing its rigidity. This increase in rigidity causes the velocity of P-waves to increase as they move through the hydrate-bearing sediment Even when hydrate concentrations are low, the increased seismic velocity can often be detected.
Two seismic phenomena related to the occurrence of hydrate have been identified: the bottom simulating reflector (BSR), and a reduction in reflection amplitude, called blanking. Seismic lines from deep continental shelves all around the world contain anomalous reflections known as BSRs. The reflections mimic the sea-floor topography at a near constant depth below the surface, and commonly cut across geological layers. The nature of the reflection indicates a horizon across which seismic velocity dramatically decreases. Once the existence of natural methane hydrate was established, BSRs were thought to record the decrease in velocity when passing from hydrate-bearing sediments to those containing only water. Accordingly, BSRs were thought to be a direct indicator of hydrate: no BSR meant no hydrate. However, the velocity contrast between hydrate and no-hydrate was determined to be insufficient to cause BSRs. Currently, researchers believe that BSRs are an indication of a free methane gas phase that is blocked from further upward migration by the methane hydrate present in overlying layers. Consequently, BSRs may mark only a subset of the areas containing hydrate.
Geophysical modeling indicates that the presence of hydrate results in uniform higher velocity with reduced internal acoustic contrasts (reduced acoustic impedance). This character is manifested on seismic sections as a reduction or weakening of the amplitude of the seismic reflections. Typically the zone of hydrate above the BSR exhibits few reflections, and appears as a featureless region on the seismic cross section. In lieu of actual measurements from core samples, both relative seismic velocity and the degree of blanking have been used as indicators of gas hydrate concentrations. Velocities of compressional and shear waves recorded by multichannel seismic surveys also provide information on the hydrate concentration in sediments.