Business

Business
The objective of this project is to locate and characterize natural fracture “sweet spots” and induced (hydraulic) fractures from scattered wave analysis of 4-D vertical seismic profile (VSP) data in order to optimize well placement and well spacing in low-permeability gas reservoirs.
Massachusetts Institute of Technology, Cambridge, MA
Tight gas sand reservoirs generally contain thick gas-charged intervals that often have low porosity and very low permeability. Natural and induced fractures provide the only means of production. If sweet spots containing natural fractures can be identified and located, then productive, economic wells can be brought on line. Likewise, if induced (i.e., hydraulic) fractures can be strategically placed to both connect with existing natural fractures and avoid interaction with reservoir sections being drained by other wells, then the ultimate recovery from these reservoirs can be maximized.
Results
Numerical models were used to develop and test methods for using scattered seismic energy to image and characterize hydraulic fractures. These methods were then applied to pre- and post-fracture 3D VSP data sets acquired at the Jonah Field in Wyoming. Researchers adapted and tested a 3-D finite difference model to generate elastic VSP and microseismic data for a simplified hydraulic fracture in a layered earth. Synthetic 3-D VSP data were generated for an initial range of fracture parameters, including two different fracture compliance values. The results illustrate the sensitivity of the scattering amplitude to fracture compliance (aperture). Researchers completed extensive simulations of VSP data sets for unfractured, compliant, and stiff fracture models, developed processing software for component rotation, arrival picking, time-differencing, and stacking of synthetic 4D VSPs and microseismic events, and tested a methodology for extraction of P and S scattered wave energy from 4D VSP synthetics for the characterization of fracture properties (compliance).
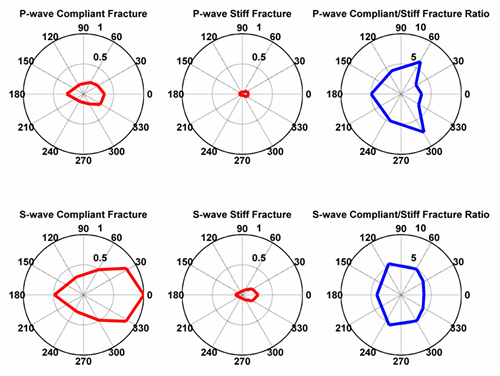
Modeling results indicate that open fractures (those with high compliance) have larger P and S wave scattered amplitudes than closed fractures (those with low compliance), providing confidence that the basic methodology can isolate the fracture signals and differentiate between open and closed fractures. Additional models using multiple fractures and more realistic background velocity structures were also generated. The presence of multiple fractures results in more complex scattered wave signals, making it more difficult to isolate and analyze the signals from a single fracture. By applying the P and S moveouts obtained from microseismic events at each fracture location, we were able to isolate the scattered wave VSP data for analysis.
Numerical model results indicate that the scattered energy is greatest, and therefore most easily detected, on the records of the acquisition geometries where the sources and receivers are inline with the normal to the fracture surface. For the stiff fracture it is difficult to see the scattered energy on the other, non-normal, raw VSP cases. For the compliant fracture case, the scattered energy is observable on nearly all the raw VSP records. Initial results from these synthetic data also suggest that it may be possible to discriminate between open and closed fractures by the azimuthal change in the scattering as seen on the P and S wave RMS energy ratio plots. The modelling results show that it may be possible to extract the relative quality of induced fractures within a tight gas reservoir from a time lapse VSP when used in conjunction with microseismic recordings. The workflows developed in the modeling phase were then applied to data from a Wyoming tight gas field.
A VSP processing software system was created to form the time lapse VSP data set from the before fracturing and after fracturing VSP surveys. The required processing steps on each survey include: amplitude scaling, band pass filtering to a consistent signal spectrum, trace editing to eliminate bad traces caused by poor geophone coupling, fk filtering to remove tube waves, and phase matching of the two surveys to make the Vibroseis source signatures identical. Following this processing, the difference data volume is migrated and stacked for multiple locations along each fracture plane to provide a detailed look at the amount of scattering from locations along the fracture planes. The processing and imaging methodologies were developed and calibrated by using model data, then applied to the field data.
Pre and Post-fracture VSP field data from the Jonah Field were processed to create a 4D (difference) volume, which was then migrated to produce scattered wave images of the fracture zones. The field data results indicate that scattered wave energy from the fractures is present in the data. This scattered wave energy difference data show behavior similar to that observed in numerical models of simple compliant fractures. The images of fracture planes from the scattered wave signals show the most coherent energy when the fractures are illuminated from source points located normal to the fracture plane, which is consistent with what was seen in numerical modeling results. Finally, variations in reflectivity along the fracture plane are observed, suggesting that this imaging method can provide a means of detecting spatial fracture quality differences as an aid to optimizing fracture programs in tight gas reservoirs.
Benefits
By using time-lapse VSP imaging before and after hydraulic fracturing, researchers will develop methods for characterizing the flow properties of fractures from seismic data. An improved understanding of the geometry and flow characteristics of hydrofracs will allow producers to optimize the number and location of wells and fractures. Hydrofracture compliance, which is related to fracture aperture, will be characterized by developing a diagnostic from the seismic scattered wave amplitudes. The seismic scattering signatures of these “known” hydraulic fractures will also provide a much-needed calibration point for identifying natural fracture sweet spots from both surface seismic and VSP data.
Summary
Using the results of the single and multiple fracture numerical models, a workflow for isolating the scattered wave energy from the VSP records and stacking the P and S wave events using operators extracted from the microseismic records was developed. In summary, 3-D VSP data acquired before the hydraulic fracturing is subtracted from the same data acquired after fracturing, resulting in a time-lapse (4-D) VSP data volume. This data volume contains scattered wave signals generated by the interaction of the propagating seismic energy and the hydraulic fracture. Microseismic events generated by the fracturing process, and recorded in the same monitoring well used for VSP acquisition, provide a direct measure of the travel paths of data from the fracture to the receivers and also give the location and orientation of the fractures. The moveout of P and S wave arrivals from the microseismic events across the receiver array can be used as an operator for stacking the 4-D VSP scattered wave signals. The results are P and S scattered wave amplitudes as a function of illumination angle or azimuth for each surface source point in the VSP. These amplitude values provide a diagnostic of fracture quality based on the fact that high compliance ‘open’ fractures scatter more seismic energy than low compliance ‘closed’ fractures. While the actual properties of the fractured zone itself are difficult to estimate, we can identify areas with relatively higher fracture quality, i.e. open and compliant properties. There is about a factor of five between the amount of scattered energy measured for the compliant and stiff fracture cases. This means that the economically important, open and compliant fractures will scatter more energy than the less important, closed and stiff fractures. It is much more likely that the fractures contributing to permeability of the gas will be the ones that will be detectable by this method. Application of these methods to field data from a tight gas sand indicate that scattered wave signals can be measured and these signals have been used to image the fractures from a range of different azimuths in the plane defined by the locations of the microseismic events. The results show that when the fractures are illuminated from sources located along the fracture normal the image is most coherent. Variations in the fracture reflectivity along the fracture plane are possible indicators of changes in the fracture compliance, which may be related to fracture aperture variations and hence flow capacity of the fracture.
(January 2009)
The project has been completed. The first phase focused on numerical simulation of seismic scattering from hydraulic fractures and the development of processing and analysis methodologies to extract fracture quality diagnostics. The second phase of the project focused on analysis of field data from a tight gas sand reservoir in Wyoming. The final project report is available below under "Additional Information".
Funding
This project was selected in response to the DOE National Energy Technology Laboratory Fossil Energy Research and Development solicitation DE-PS26-06NT42787.
$579,738
$395,526 (40% of total)
NETL – Chandra Nautiyal (chandra.nautiyal@netl.doe.gov)
MIT – M. Nafi Toksoz (toksoz@mit.edu or 617-253-7852)
Final Project Report [PDF-6.27]