Business

Business
The project goal is to analyze nanoscale pore chalk structure in the context of challenges of producing oil from chalk.
Lawrence Berkeley National Laboratory (LBNL)
Berkeley, CA
The new 3-D nanoscale pore imaging FIB method, based on Focused Ion Beam technology and serial sectioning, has been developed under the Pore Scale Imaging work at LBNL previously funded by DOE. FIB allows the milling of layers as thin as 10 nanometers by using 30keV accelerated Ga+ ions to sputter atoms from the sample surface. After each milling step, as a new surface is exposed, a 2-D image of the surface is generated. Next, the acquired 2D images are segmented into pore/nonpore voxels. and are stacked to reconstruct the 3-D pore or grain structure. Resolutions as high as 10 nm are achievable.
As part of the joint development of an Electronic Core Laboratory at LBNL and University of California at Berkeley, researchers devised the MIS method of pore space morphology and pore-scale fluid flow. MIS uses direct morphological analysis of the rock pore space to characterize the petrophysical properties (porosity, permeability, relative permeability and capillary pressures) of diverse formations.
Results
Researchers applied two novel methods: Focused Ion Beam (FIB) submicron pore imaging and Maximum Inscribed Sphere (MIS) pore/petrophysical characterization to model two-phase flow in chalk in order to calculate capillary pressure curves.
Benefits
For many rocks of high economic interest such as chalk, diatomite, tight gas sands, or coalbeds, nanoscale resolution is needed to image the 3-D pore structure, which controls the fluids flow and trapping in these rocks.
FIB pore imaging is the only method that allows the 3-D imaging of nanoscale pore structures MIS is a new and robust method that uses direct morphological analysis of the rock pore space to characterize the petrophysical properties (porosity, permeability, relative permeability, and capillary pressures) of diverse formations. In addition, flow processes such as those encountered in various improved oil recovery approaches can be simulated. Combining the two methods allows fast characterization of oil flow and trapping in reservoirs of major economic interest.
Summary
The project highlights include the following:
(July 2006)
The funding did not extend to the original end date of the project (only $40,000 was received), and the project was completed in 2005.
$40,000
$0
NETL – Purna Halder (purna.halder@netl.doe.gov or 918-699-2084)
LBNL – Liviu Tomutsa (ltomusta@lbl.gov or 510-486-5635)
Publications
Tomutsa, L., Silin, D., and Radmilovic, V., Nanometer-Scale Imaging and Pore-Scale Fluid Flow Modeling in Chalk, SPE 99558, under review for publication in SPE Reservoir Evaluation & Engineering.
Tomutsa, L., and Silin, D., Nanoscale Pore Imaging and Pore Scale Fluid Flow Modeling in Chalk, invited talk, 25th Annual Workshop & Symposium, Collaborative Project on Enhanced Oil Recovery, International Energy Agency, Stavanger, Norway, September 5-8, 2004.
Tomutsa, L., and Silin, D., Nanoscale pore imaging and pore scale fluid flow modeling in chalk, submitted to NETL in August 2004.
Tomutsa, L., and Radmilovic, V., Focused Ion Beam Assisted Three-Dimensional Rock Imaging at Submicron Scale, International Symposium of the Society of Core Analysts, Pau, France, September 21-24, 2003.
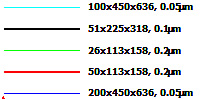 Comparison of scaled invasion-percolation capillary pressure curves (solid lines) with experimental drainage capillary pressure curve digitized from Spinler and Baldwin, 1997 (red dotted lines). The diamonds denote the points where the nonwetting fluid becomes disconnected. Different colors denote different voxel sizes used in computations.