Business

News and Events
Research and Programs
Business
The goal of this project is to quantify fugitive and total emissions of methane from the Marcellus gas production region of north-central Pennsylvania, with an emphasis on detecting changes in emissions over time caused by changing gas production activity.
The Pennsylvania State University (Penn State), University Park, PA 16802-5000
National Oceanic and Atmospheric Administration (NOAA), Boulder, CO 80305-3337
The Regents of the University of Colorado (CU), Boulder, CO 80309-0572
Picarro, Inc., Santa Clara, CA 95054-1000
Shale gas development in many parts of the U.S. has raised concerns about the contribution of methane emissions to the greenhouse gas (GHG) footprint. Estimates of total methane leakage have been estimated from 1 to 7 percent of shale gas production with the greatest leakage occurring during the production stage. U. S. government reports of shale gas emissions have varied greatly in recent years with the U.S .Environmental Protection Agency (EPA) reporting the estimated national average production-sector leak rate as 0.16 percent of production in 2010, 1.42 percent in 2011 and 2012, and 0.88 percent in 2013. These variations were driven mainly by changes in the EPA’s assumptions for calculating emissions from several stages of natural gas well operation. In particular, the main driver for the 2013 reduction in production emissions was a report prepared by the oil and gas industry, which contended that methane emissions from liquid unloading were more than an order of magnitude lower than the EPA’s 2011 report estimate, and that emissions from re-fracking wells in tight sands or shale formations were less than half of the EPA’s 2011 report estimate. Actual industry-wide leak rates are highly uncertain and will remain so until small-scale leakage estimates are reconciled with large-area estimates derived from atmospheric data. Accurate, regionally comprehensive, and continuous monitoring of the actual rate of leakage from shale gas production is required both to document the GHG impact of gas production and evaluate efforts to reduce emissions.
Previous measurements of fugitive emissions from gas production were based on measurements at individual components. This method has led to the creation of emissions factors which, when combined with activity data and field measurements, provide the existing emissions estimates. This approach is prone to systematic error since emissions are highly variable across production facilities, over time, and between operators. This project seeks to measure emissions over larger areas in order to address regional trends in emissions. Emissions within the Marcellus shale gas region will be sampled via aircraft, automobile, and towers in order to create a direct estimate of emissions as it relates to location and time. The shale gas methane emissions will be compared with those from other possible methane sources including landfills, wetlands, and water treatment and agricultural sources. Successful completion of the project will result in the most comprehensive set of measurements of shale gas production to date from any location, and the first long-term, large-scale emissions measurements conducted in the Marcellus shale. This new emissions measurement technology can be used to minimize fugitive emissions by quantifying leakage rates and locations, resulting in effective measures to minimize leakage. This project will reduce the current uncertainty in GHG emissions during natural gas production within the Marcellus region and provide technology suitable for continuously quantifying the GHG impact of the industry in other areas of the U. S.
Observations from the four towers were collected from September 2015 to September 2016. The methane measurements from the south and north towers were lowest and are considered background levels. The central and east towers were located downwind of the unconventional wells and had slightly higher methane readings. Differences between background and downwind measurements were often very small, but in June 2016, a large increase in methane readings was noted at the east tower location. The team attempted to identify the source of the increase and discovered the presence of “hotspots” that correlated with the expected methane inventory.
The analysis of container samples taken during the 2015 aircraft campaign was completed. Results of the mass balance flights agree with the Weather and Research Forecast Model (WRF) modeled results of regional methane emissions of 0.5 – 0.8% of all sources in the area. The last layers of the inventory of anthropogenic methane emissions have been completed. The new activity data include several layers that were collected from the public domain as well as from regional associations, including access to compressor station data set for the entire state of Pennsylvania, generated by the Clean Air Council. The data describe 570 compressor stations and is the most complete available database for Pennsylvania. For the transmission layer, about 200 to 300 miles of gathering pipelines are assumed to connect the unconventional wells to compressor stations in the three counties. This information is critical to the project as these pipelines are not monitored nor inspected by the Pennsylvania Department of Environmental Protection (DEP), and could therefore emit large amounts of methane in the atmosphere.
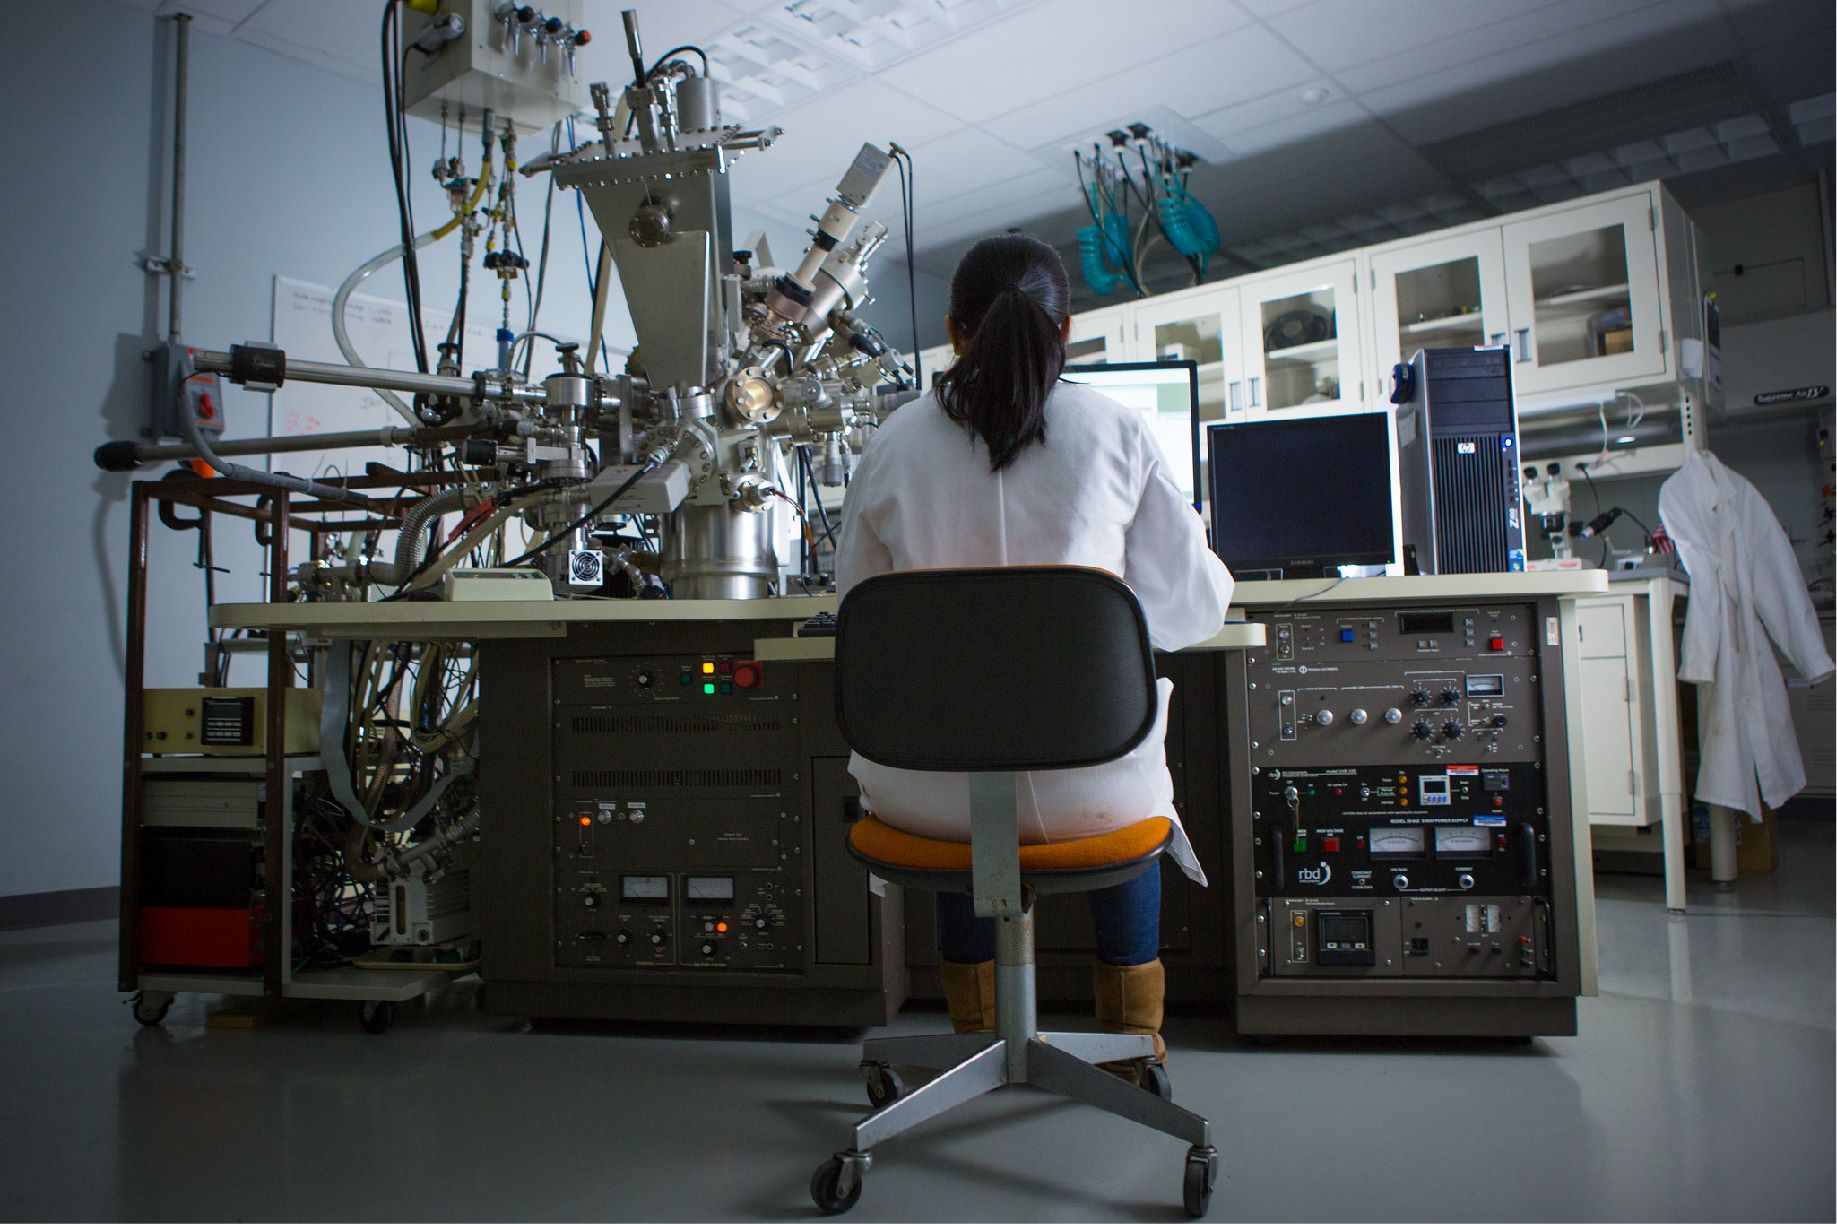
The research team has collected additional activity data in prior emissions (distribution and transmission sectors, industries, wetlands, coal) for the preparation of a bottom-up CH4 emission map. Instruments have been deployed at four tower sites in northcentral Pennsylvania, both isotopic methane analyzers and automated flask samplers. The towers were active during the intensive campaign in April and May 2015, which included NOAA aircraft flights and drive-arounds. Aircraft samples were measured for trace gases, methane, ethane, water, halocarbons, and hydrocarbons. The tower results will be used along with ground-based and aircraft measurements to determine the relative contributions of industry, gas wells, landfills, and other sources to the overall methane emissions in the area.
Team members completed a month-long deployment of the NOAA aircraft in summer 2015 which was instrumented with a continuous CRDS CO2/CH4/CO/H2O analyzer and an ethane analyzer. Flask samples were collected aboard the aircraft and measured for the same species as the tower samples, including C13-CH4. The aircraft flask samples have been shipped back to NOAA/ESRL and CU/INSTAAR in Boulder, CO for analysis. The CU team has designed and built a system for collecting samples of air in bags in addition to the flasks.
Researchers are developing a GIS database that will contain information on different sources of methane in Pennsylvania and New York, including wells, landfills, and wetlands. Four locations for methane monitoring towers have been established and one more tower site may be added to the project (with additional cost share from a new project partner). The team continues to search for gas pipeline GIS data to incorporate into the database.
Large atmospheric signals were identified from a limited sub-region in northeastern Pennsylvania with several unidentified peaks. The WRF CH4 model is able to correctly simulate the regional enhancement and the readings due to coal mines in the area. The 2015 aircraft campaign was successfully completed with 12 flights with both raster tracks and mass-balance paths. Data is available on Marcellus website: http://sites.psu.edu/marcellus/data-download/. The model output visualization website is: http://www.met.psu.edu/.
Based on four drive-around mobile campaigns in Pennsylvania and New York in 2014, the first estimate of methane emissions near gas wells is approximately 2% of production. Results show that emissions from unconventional gas wells are most likely intermittent, and levels are dependent on the stage of the well development. WRF results agree with observed contributions from unconventional wells. Methane inventory data are being gathered and include fugitive emission estimates from natural gas activity during transmission and distribution and emissions from natural seeps and wetlands. Researchers will perform simulations of wetland methane emissions using a high resolution vegetation model.
Mobile emission sampling campaigns were completed in three Pennsylvania counties. Results were analyzed and contributions broken down as thermogenic and biogenic sources. These data are publicly available on the project webpage located at http://sites.psu.edu/marcellus/data-download/.
Researchers constructed spatially resolved methane emission estimates from livestock farming based on agricultural data provided by Penn State’s College of Agriculture.
The Weather Research and Forecasting - Four Dimensional Data Assimilation (WRF-FDDA) atmospheric modeling system has been configured for the network design. The initial methane emissions inventory has been created at 1 km resolution and coupled to the WRF-FDDA system. The modeling system will be used to optimize the locations of the four tower-based methane sensors.
The project ended May 31, 2017.
Conclusions of the project:
Leakage rate equivalent to 0.4% of production (wells and gathering compressors);
Site-level estimate (about 15 wells in PA): 0.64% of production (wells only);
EPA-derived estimate for NE PA: 0.13% of production;
Aircraft mass-balance for NE PA: 0.3% of production.
Data from towers:
2015 to 2017 data archive for CH4 and 13CH4 continuous tower measurements in Northeastern PA.
Data from the 2015 aircraft campaign:
Aircraft Campaign over the Northeastern Marcellus Shale (May 2015).
$1,782,725
$445,682
NETL – Sandy Borek (sandra.borek@netl.doe.gov or 412-386-4533)
PSU – Thomas Lauvaux (tul5@psu.edu or 814-865-0478)