

Carbon Storage Atlas
- Why this Location
- Main Research Q&As Discovered
- Advice for Future Operators
- Field Site Story of Interest
- Project Introduction and Site Operations
- Site Characterization
- Risk Assessment
- MVA
- SWP Resources
- Sites
Lat/Long
Farnsworth Field is located in Ochiltree County, Texas, approximately 24 kilometers (~15 miles) southwest of Perryton, Texas.
Coordinates: 36.2796667, -101.0666174.
Why this Location
The Southwest Regional Partnership on Carbon Sequestration (SWP) explored several options for their Phase III project, entering into negotiations and contracts several times during a five-year period before finally formalizing a partnership with the site operator at the Farnsworth Unit (FWU) field site. Ultimately, FWU proved to be an excellent field project; SWP gained a willing operating partner who had a successful business model at the field; the field was using anthropogenic carbon dioxide (CO2); and the study area provided an opportunity to look at parts of a reservoir already exposed to CO2, as well as areas that had not yet been flooded. Another significant advantage of FWU was that the field was already operational, with CO2 purchase contracts and extensive compression, injection infrastructure, and transport pipelines.
There were, however, some projects that did not come to fruition. One of the earliest projects proposed use of CO2 sourced from a gas processing plant for saline storage. Further analysis by the field operator showed it would be more profitable for them to transport CO2 to the Permian Basin for enhanced oil recovery (EOR) activities; they requested to be removed from the project. A second proposed site and project ended in stalled negotiations due to the operator’s concerns over budget issues. At a third location (Gordon Creek, Utah), SWP was able to conduct some early-stage site characterization and field maintenance activities. This project encountered difficulties from the beginning: operator concerns over the liability entailed in a Class V or VI well; delays in data acquisition and permitting due to land-use restrictions; and general project concerns that such a large amount of U.S. Department of Energy (DOE) funding would be spent on infrastructure (pipeline and compression).
Main Research Q&As Discovered
At the Farnsworth Unit (FWU) field site, there is no single overriding research question. The objective has been to obtain a full and detailed understanding of the whole enhanced oil recovery (EOR)/storage system at the site while developing workflows and best practices that would serve as guidelines for future commercial operations. Some research questions concerned characterization:
- Was the geology at FWU suitable for long-term carbon dioxide (CO2) storage in terms of capacity, injectivity, and seal?
- What techniques and types of study yielded the best understanding of the field?
- Could the developed models adequately simulate the processes in place at FWU?
Other questions related to monitoring and verification:
- What methods of monitoring provided useful information?
- What techniques didn’t work?
- What might work with some modification?
Short answers to those questions are:
- FWU does have suitable capacity and injectivity.
- Primary and secondary reservoir seals have excellent strength and integrity.
- Incorporating hydraulic flow units into reservoir models enabled the project to integrate heterogeneity and create sophisticated simulation models.
- Reprocessed and reinterpreted 3D seismic surveys have enhanced understanding of field architecture.
- Advanced co-optimization simulations of FWU operations have shown that the optimal EOR strategy in terms of patterns, cycles, and use of purchased versus recycled CO2 is also near-optimal for storage.
- Measurements of soil gas, atmospheric gas, and groundwater compositions in nearby wells reveals primarily seasonal variations in CO2 amounts and water chemistry is most likely attributable to agricultural activity. There is no indication that CO2 is escaping from reservoir rocks.
- Other monitoring methods still in testing have raised almost as many questions as they have answered. Tracer testing and eddy flux tower results have been difficult to interpret due to reservoir heterogeneities and immature data analytics, respectively.
- 4D vertical seismic profiles (VSP) require a significant time span between baseline and repeat measurements to show quantifiable changes in reservoir CO2 distribution.
- Early borehole microseismic data was extremely noisy and difficult to process; new digital downhole and surface geophone arrays may, in time, provide useful information about the application of this technique for monitoring, verification, and accounting (MVA).
Advice for Future Operators
Some of the most interesting work at the Farnsworth Unit (FWU) field site has been on simulation of strategies for co-optimizing both carbon dioxide (CO2) storage and enhanced oil recovery (EOR). Researchers developed an integrated numerical framework to co-optimize both oil production and CO2 storage performance under uncertainty (meaning not all parameters are completely known). The framework includes a field-scale compositional reservoir flow model, an uncertainty quantification model, and a neural network optimization process. The reservoir flow model was constructed based on the field geophysical, geological, and engineering data. Equation of state parameters were used to achieve field-measured fluid properties and subsequently used to predict the minimum miscible pressure (MMP). This methodology was further improved by the use of proxy models and multi-objective optimization schemes. Future operators could benefit from being able to choose the most important criteria for a project – storage, oil production, or some combination – and then simulate field operations to see how to best achieve that goal.
Field Site Story of Interest
One of the unique aspects of the Farnsworth Unit (FWU) field site was the Southwest Regional Partnership on Carbon Sequestration’s (SWP) effort to establish and maintain good relationships with the local landowners and with the field operating partners. SWP’s monitoring program required the regular collection of underground sources of drinking water (USDW) samples from nearby groundwater wells drawing from the Ogallala aquifer. These groundwater wells are all located on private property, many at occupied homes and farms, and the project needed landowner permission to access these wells. SWP did this through a program of personal visits to inform landowners and occupants about the project and its general and specific goals. The project took note and followed any particular requests landowners had about timing of visits or advance notification, and an effort was made to let people know when sampling visits would occur. In the early phases of the project, results of water chemistry testing were shared with landowners. The project also attempted to follow requests regarding land use and timing of various studies. In this highly agricultural landscape, most farmers do not want any equipment operating (for example, doing a geophysical survey) in or near active farm fields, except during the winter months. All the project’s stationary equipment was maintained beyond areas regularly utilized by farming operations, such as plowing or the center pivot irrigation equipment. By honoring their requests, SWP was able to keep very equitable and agreeable relationships with most of the nearby stakeholders.
Project Introduction and Site Operations
The Farnsworth Unit (FWU) field site is located in the northeastern Texas panhandle in Ochiltree County, near the town of Perryton, Texas (see Figure 1*). The field was discovered in 1955 and was operated by Unocal until 2009. It was unitized in 1964, which is the same year waterflooding started. FWU was purchased by Chaparral Energy in 2009 and carbon dioxide (CO2) enhanced oil recovery (EOR) operations commenced in 2010, using 100% anthropogenic CO2 purchased from two sources, a fertilizer plant in Borger, Texas, and an ethanol plant near Liberal, Kansas. Carbon dioxide is transported via pipeline to FWU and other fields in the area. The field was sold again in 2017. Carbon dioxide-EOR continues, but the expansion envisioned by Chaparral has been delayed because of a decline in both oil price and CO2 availability. Production is from the Morrow B sandstone, and the field is arranged in five-spot patterns operated on a water-alternating-gas (WAG) cycle. The uniqueness of this project lies in the fact that it is a scalable CO2-EOR project based solely on anthropogenic CO2. The field is an excellent analog for many mature fields in the midcontinent.
FWU is situated on the northwestern shelf of the Anadarko Basin and is one of many fields that produce from a sequence of alternating mudstone and sandstone intervals deposited during the Morrowan period of the late Pennsylvanian (see Figure 3). Production at FWU is from the operationally named Morrow B sandstone. Primary caprock intervals at FWU are the upper Morrow shale and the Thirteen Finger limestone (see Figure 4). The reservoir is generally considered to be a fluvial channel sand deposited as part of an incised-valley depositional system (see Figure 3). The channel is formed by a fluvial system that has extended its channel basinward by erosion into underlying sediments during a time of falling sea level, and is then filled during marine lowstand. Figure 5 shows samples of cores from the field and their relative positions within a conceptual model of an incised-valley system.
* Note that figures referenced can be found on the right-hand margin of this section.
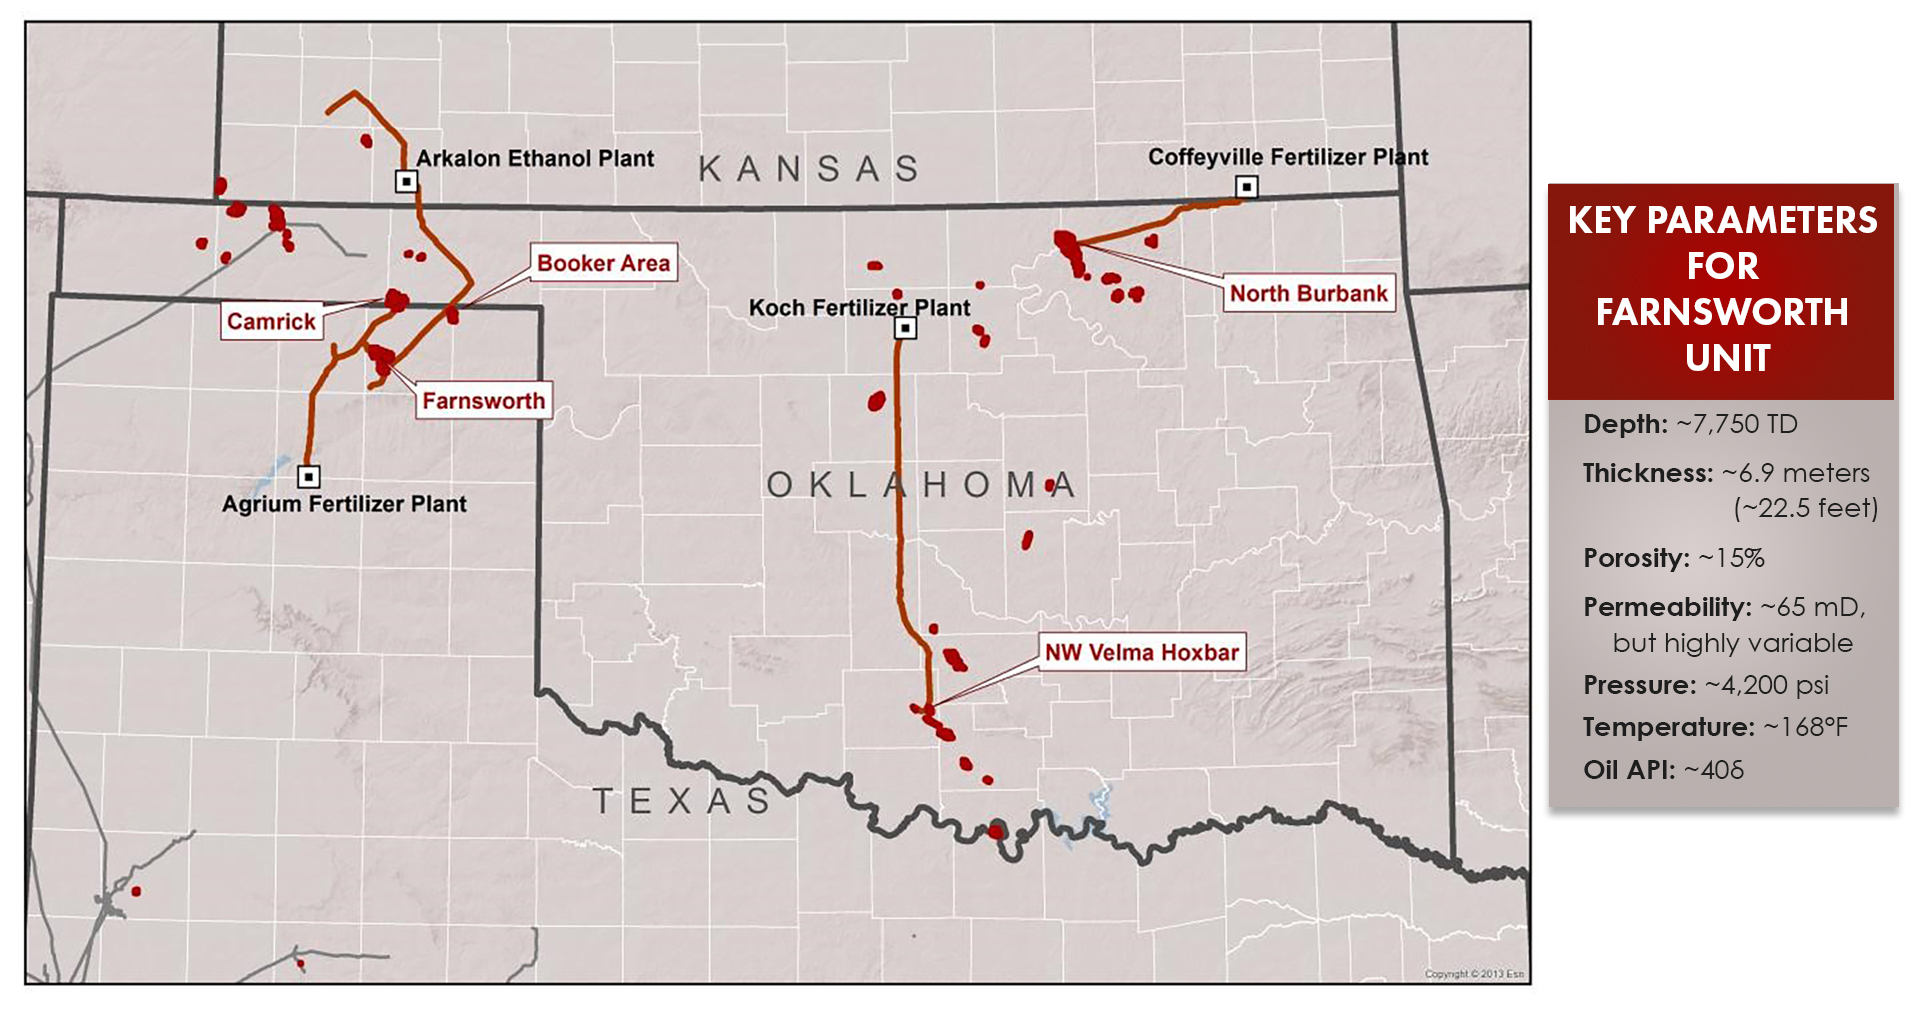
Figure 1: Regional map showing location of Farnsworth and other CO2-EOR fields, CO2 pipelines (red lines), and sources in Kansas and Texas..
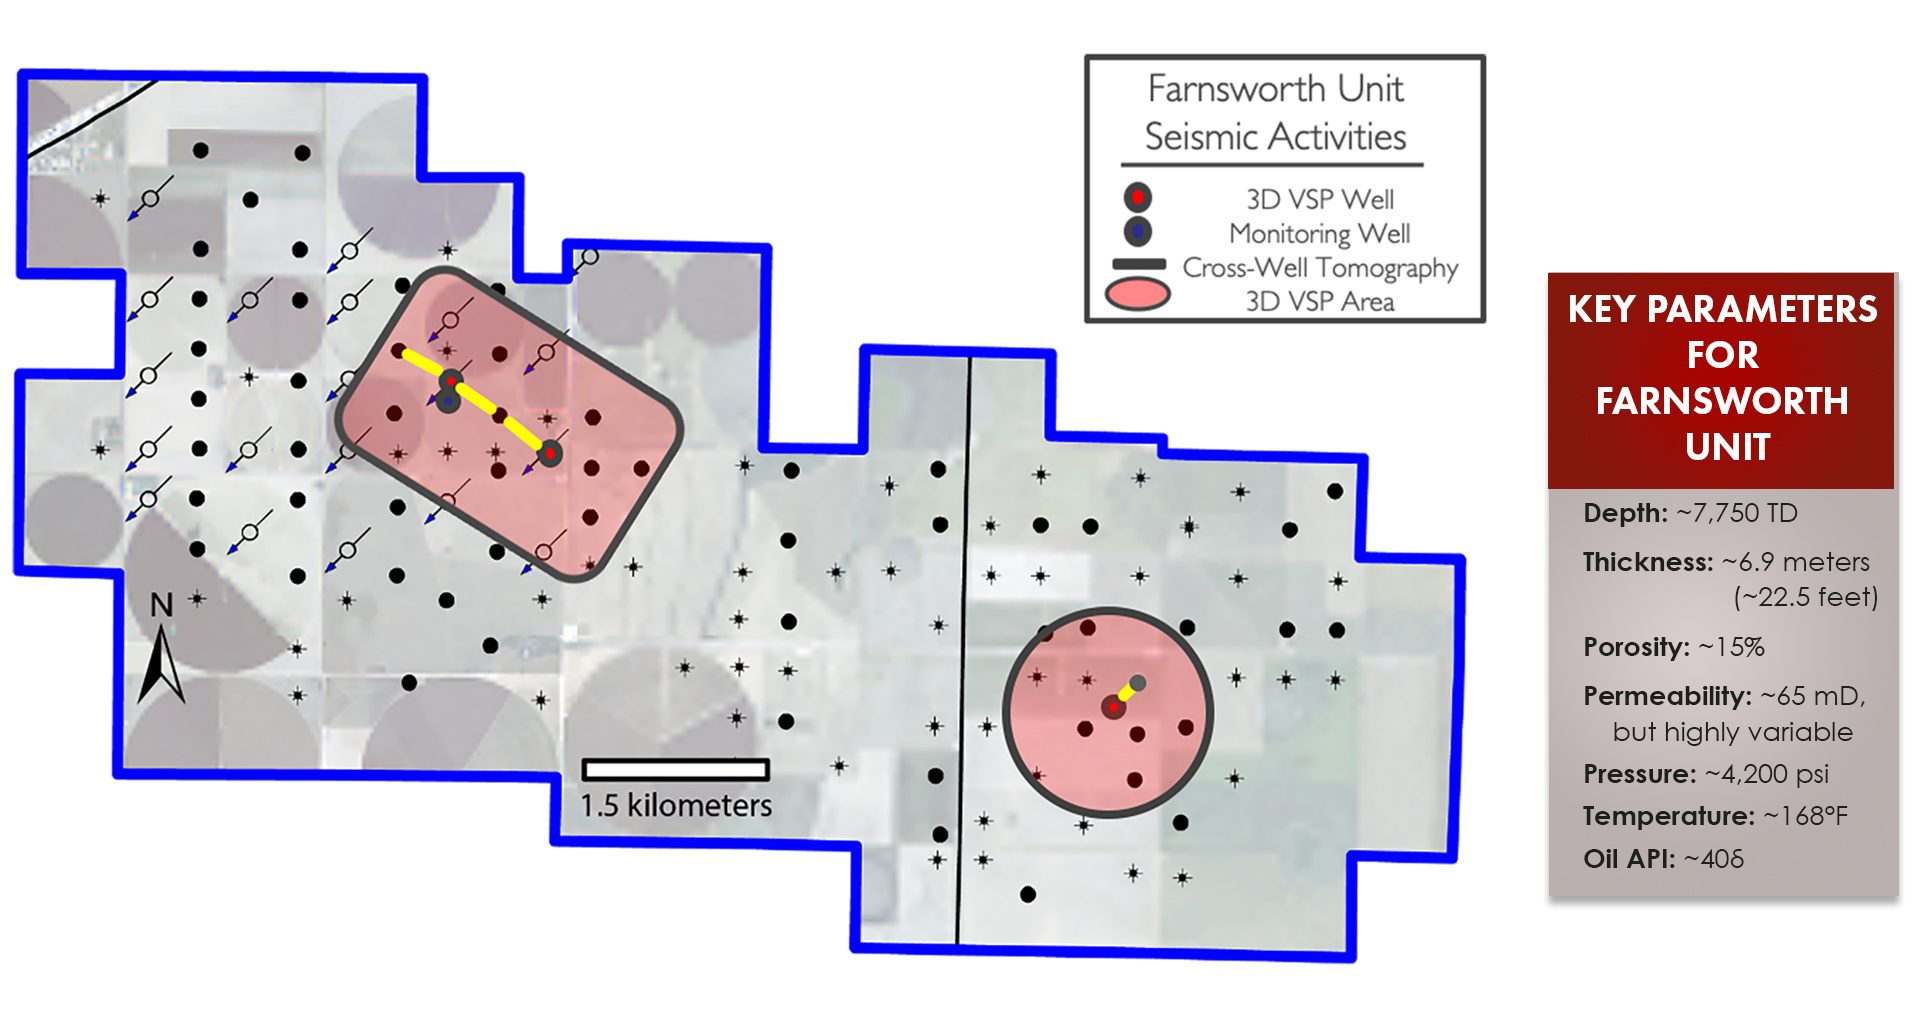
Figure 2: Farnsworth Unit field site, showing producers, injectors, outline of 3D surveys, crosswell, and vertical seismic profile (VSP) surveys.
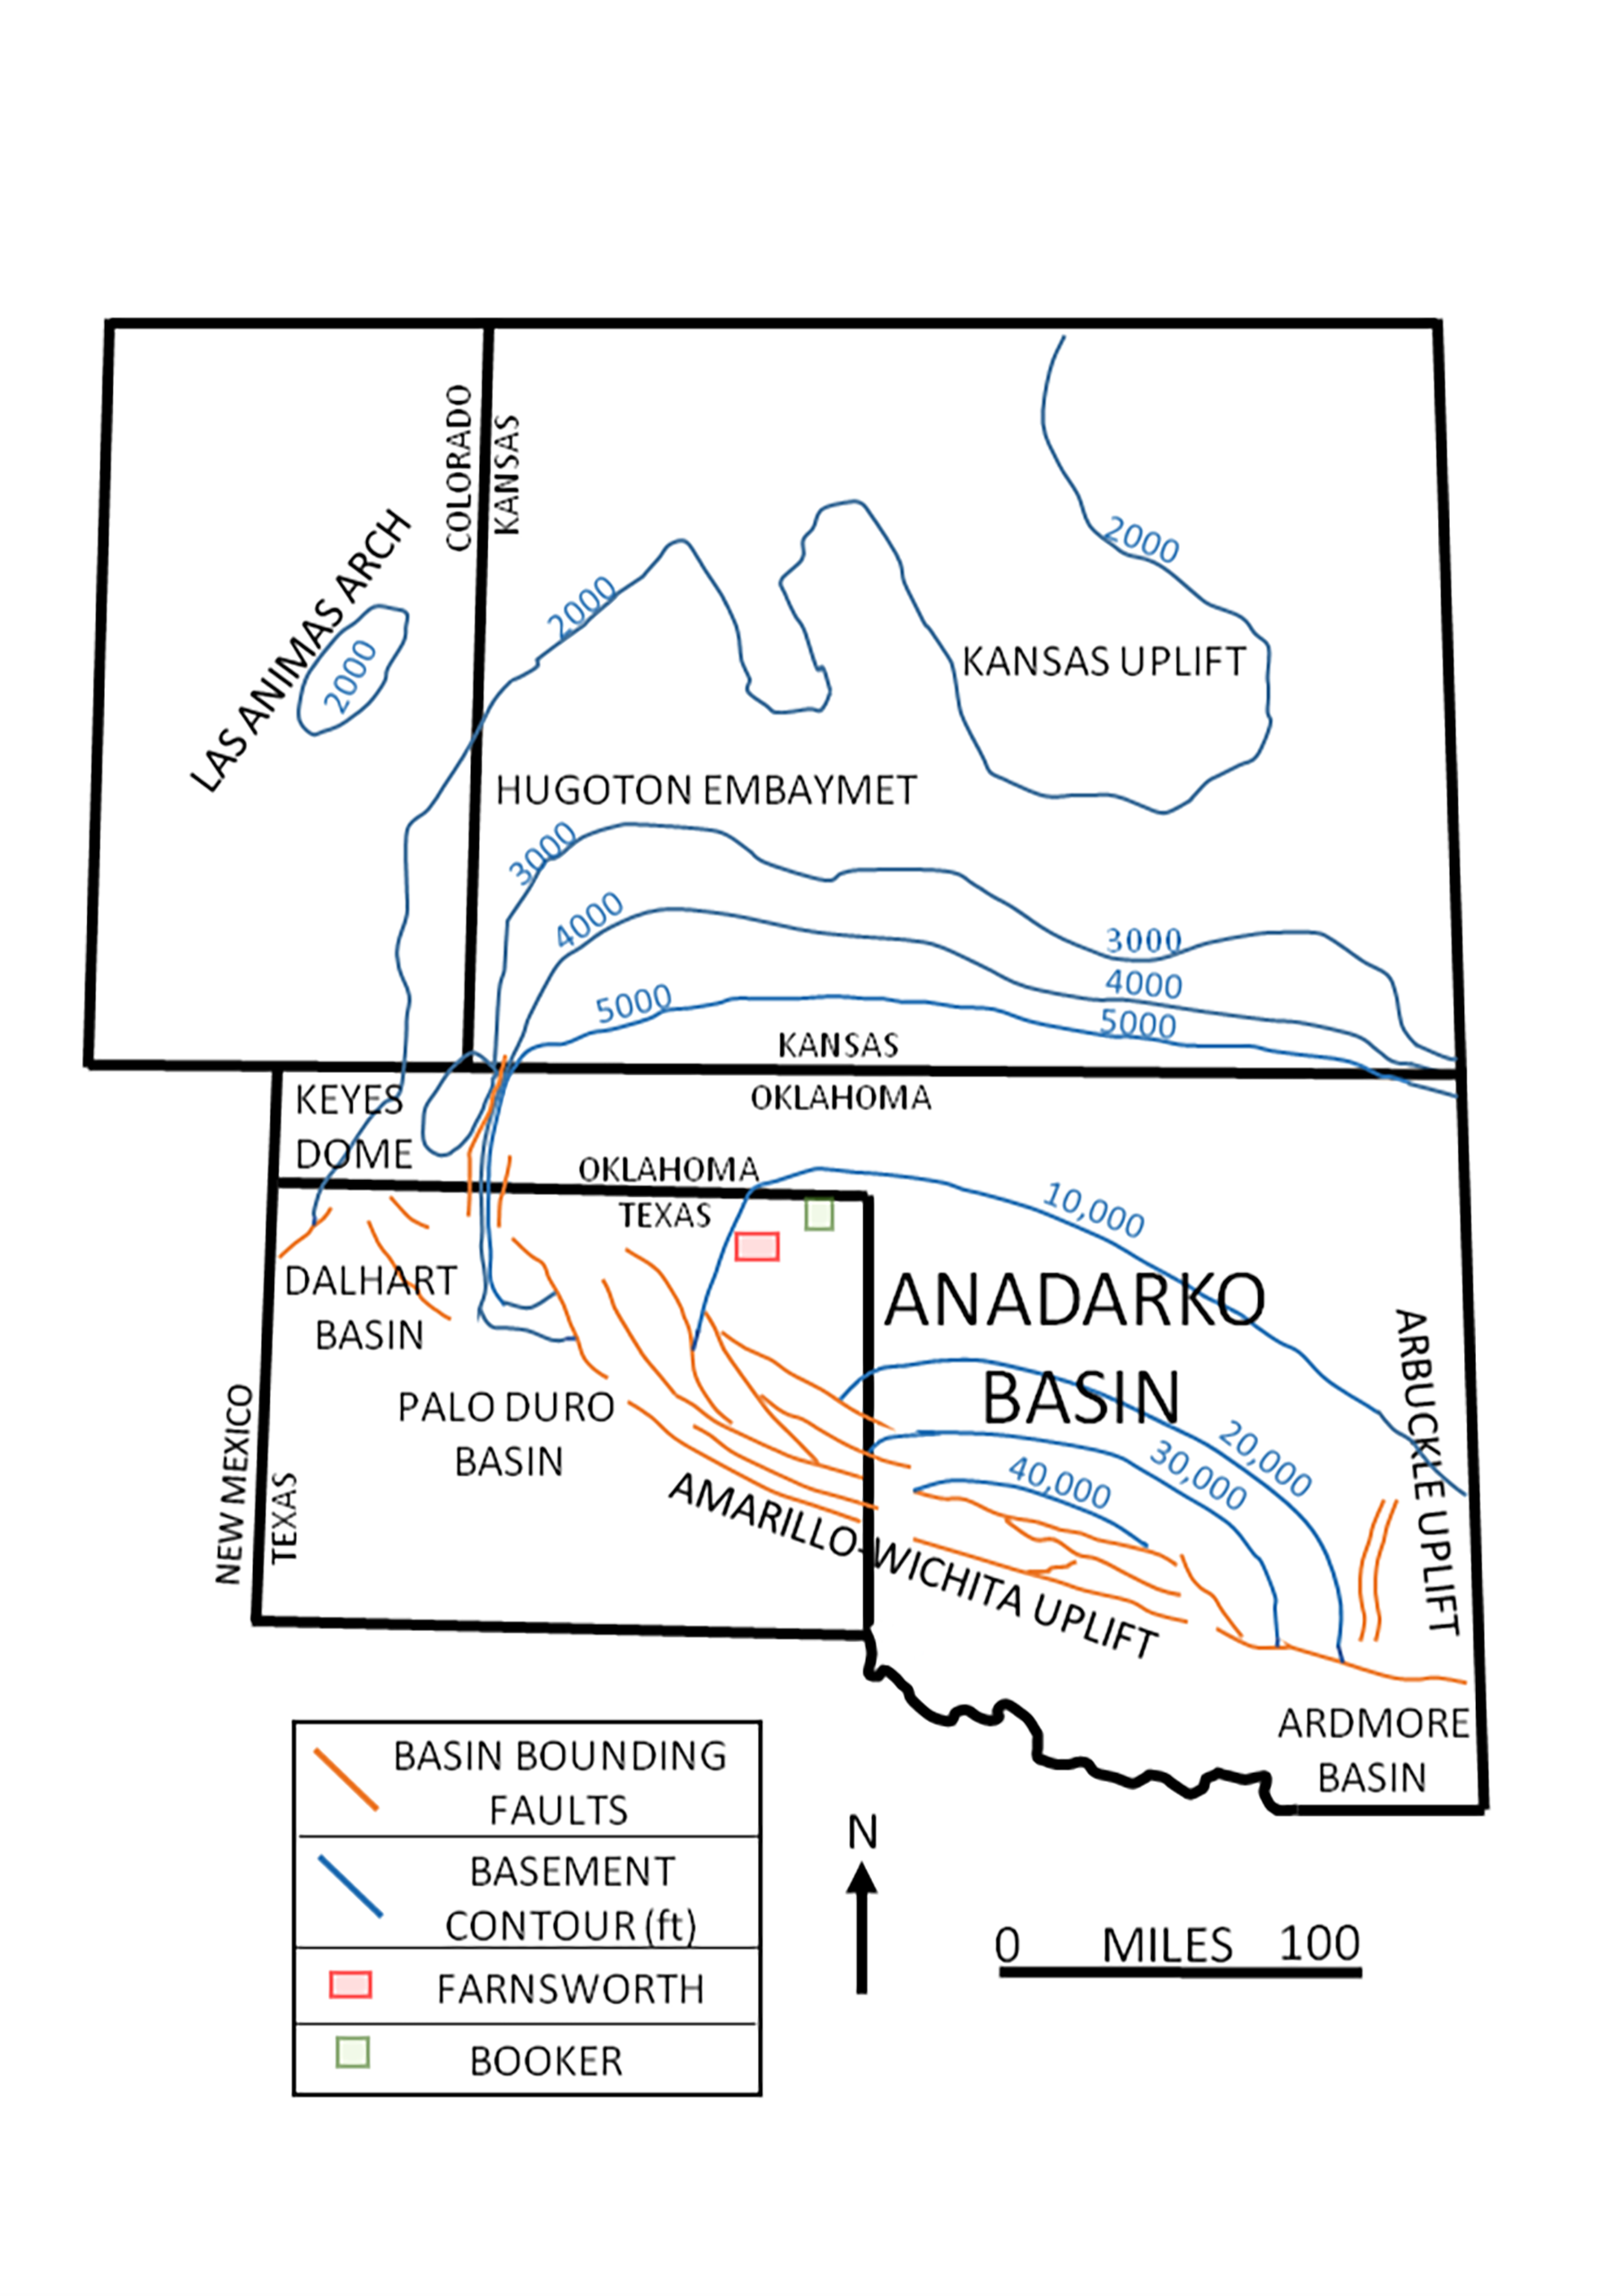
Figure 3: Regional geological setting of the Farnsworth Unit field site. Map shows basement structure with major basin bounding faults and tectonic provinces (modified from Davis and Northcutt, 1989). Map shows locations of Farnsworth (pink) and Booker (green) 3D seismic surveys used in this project.
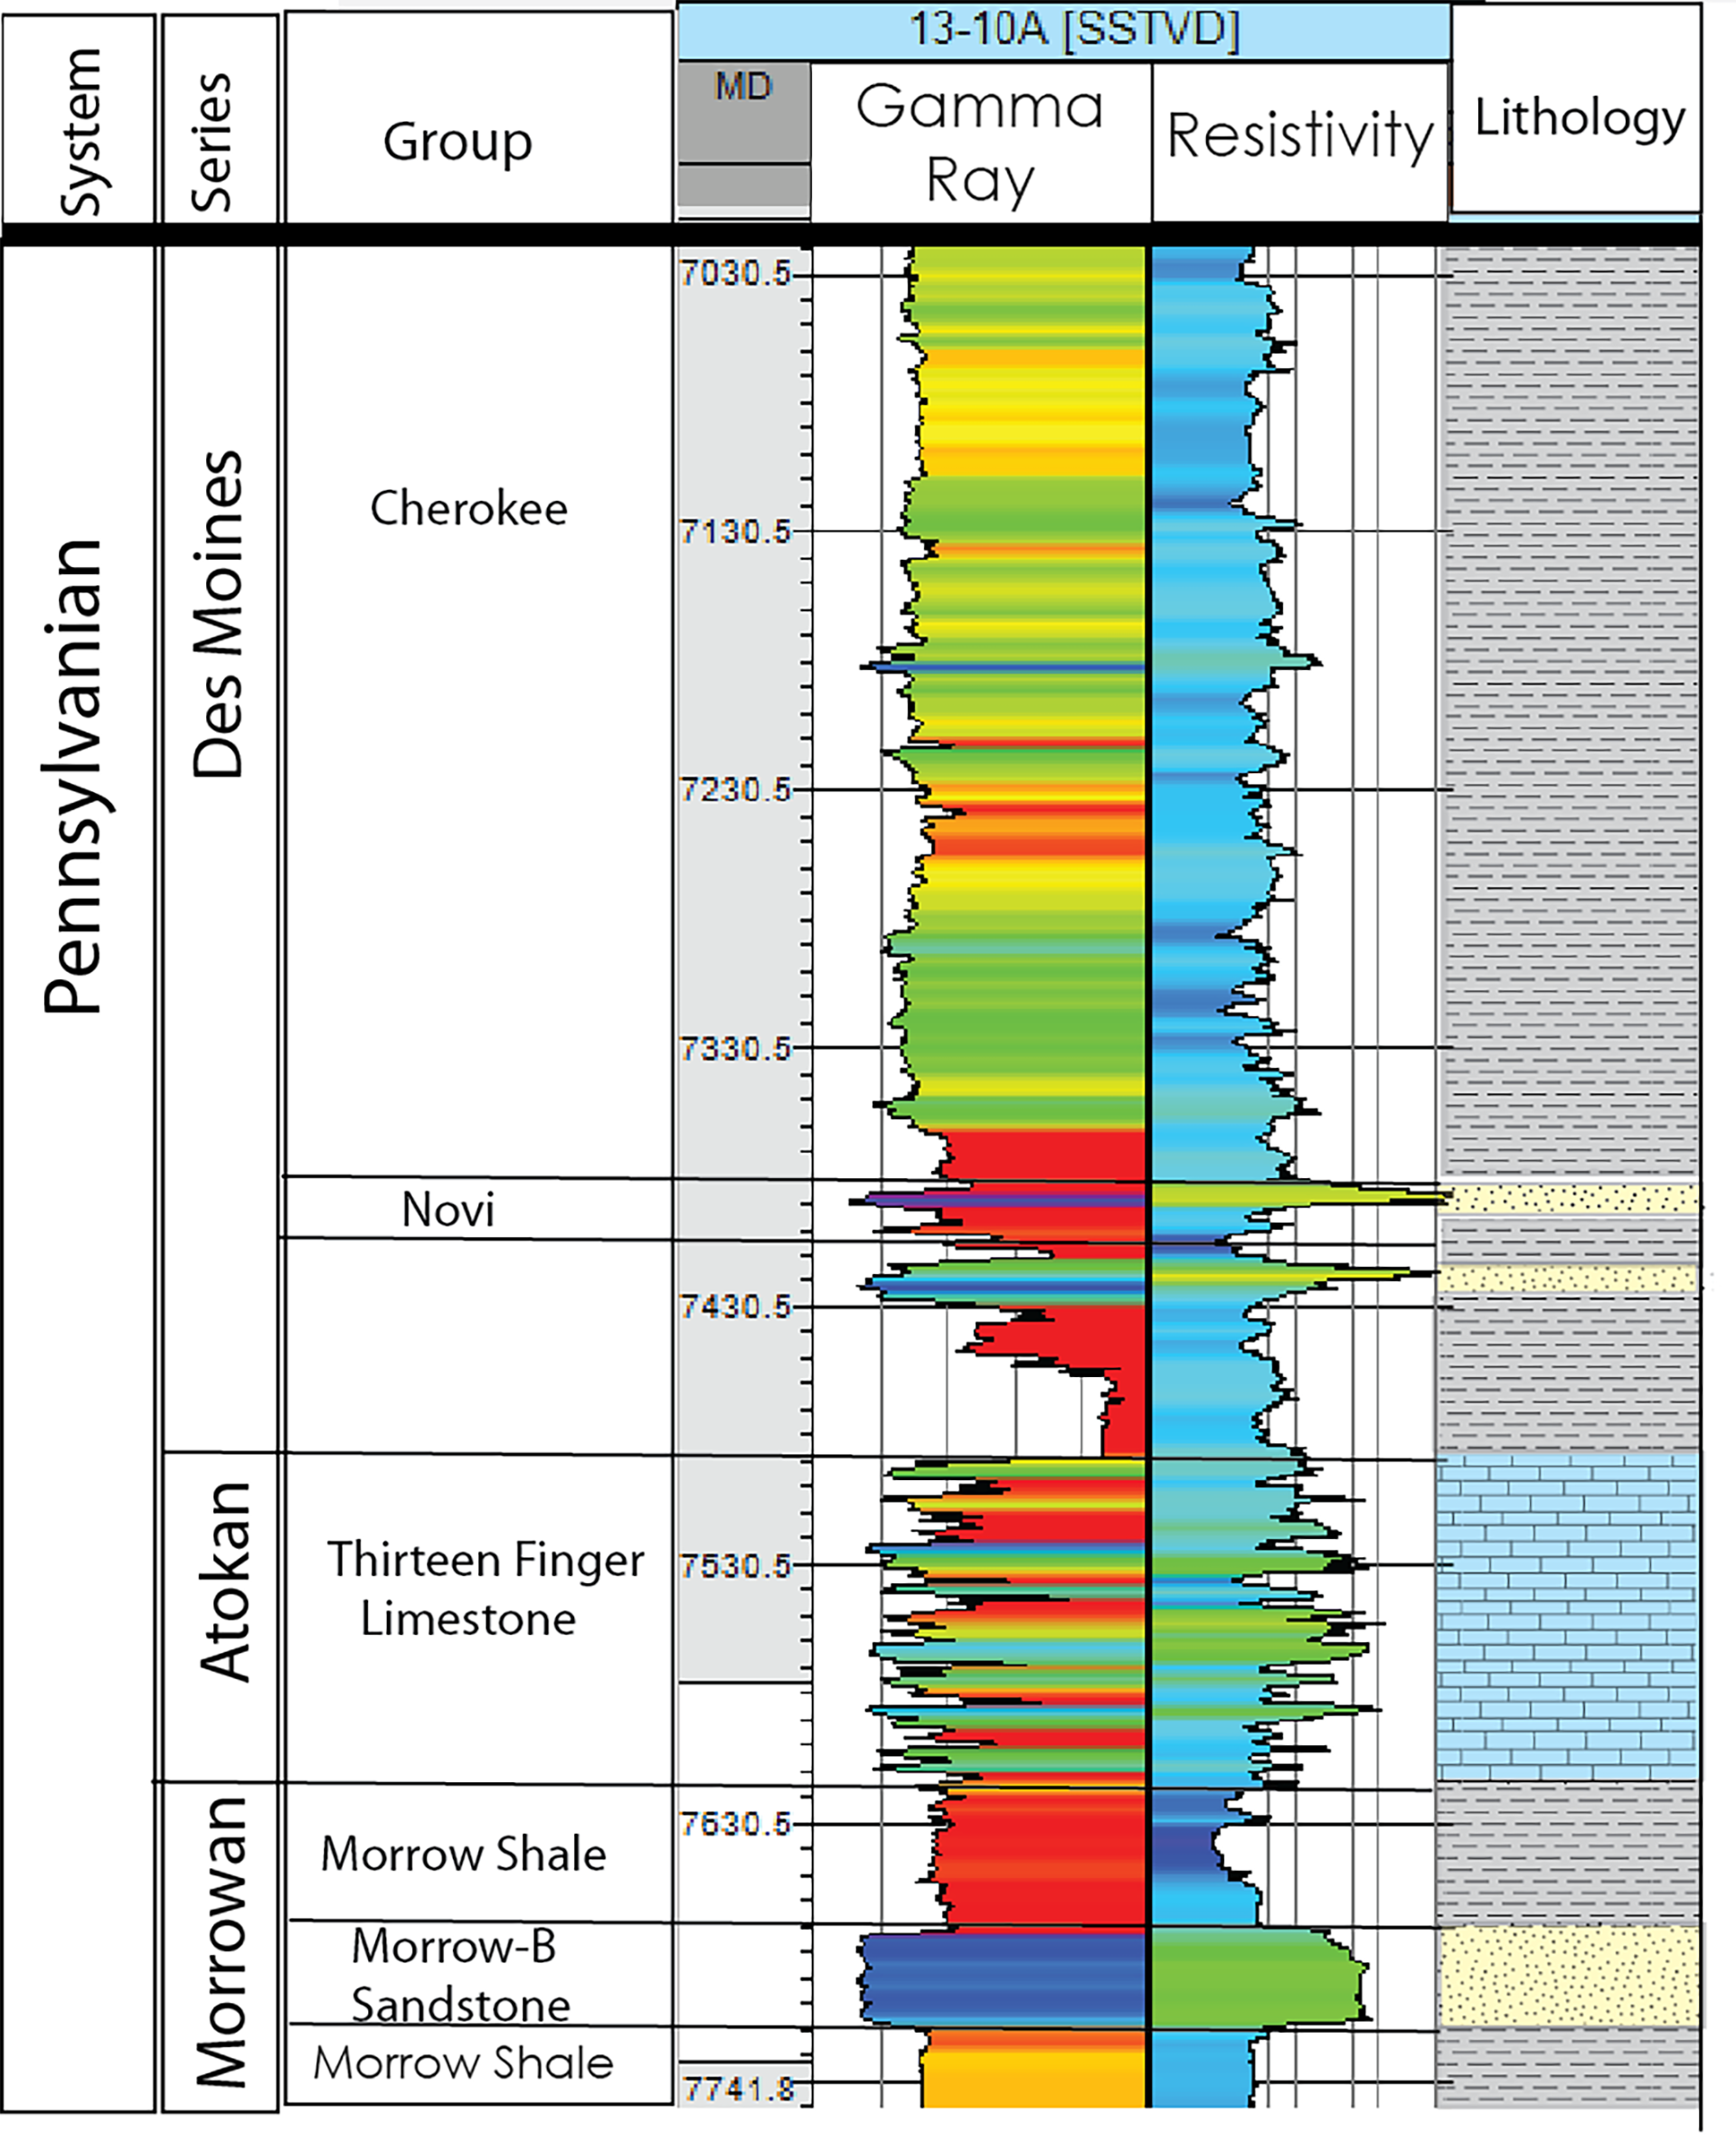
Figure 4: Stratigraphic chart for the Farnsworth area. The target reservoir is the Morrow B sandstone.
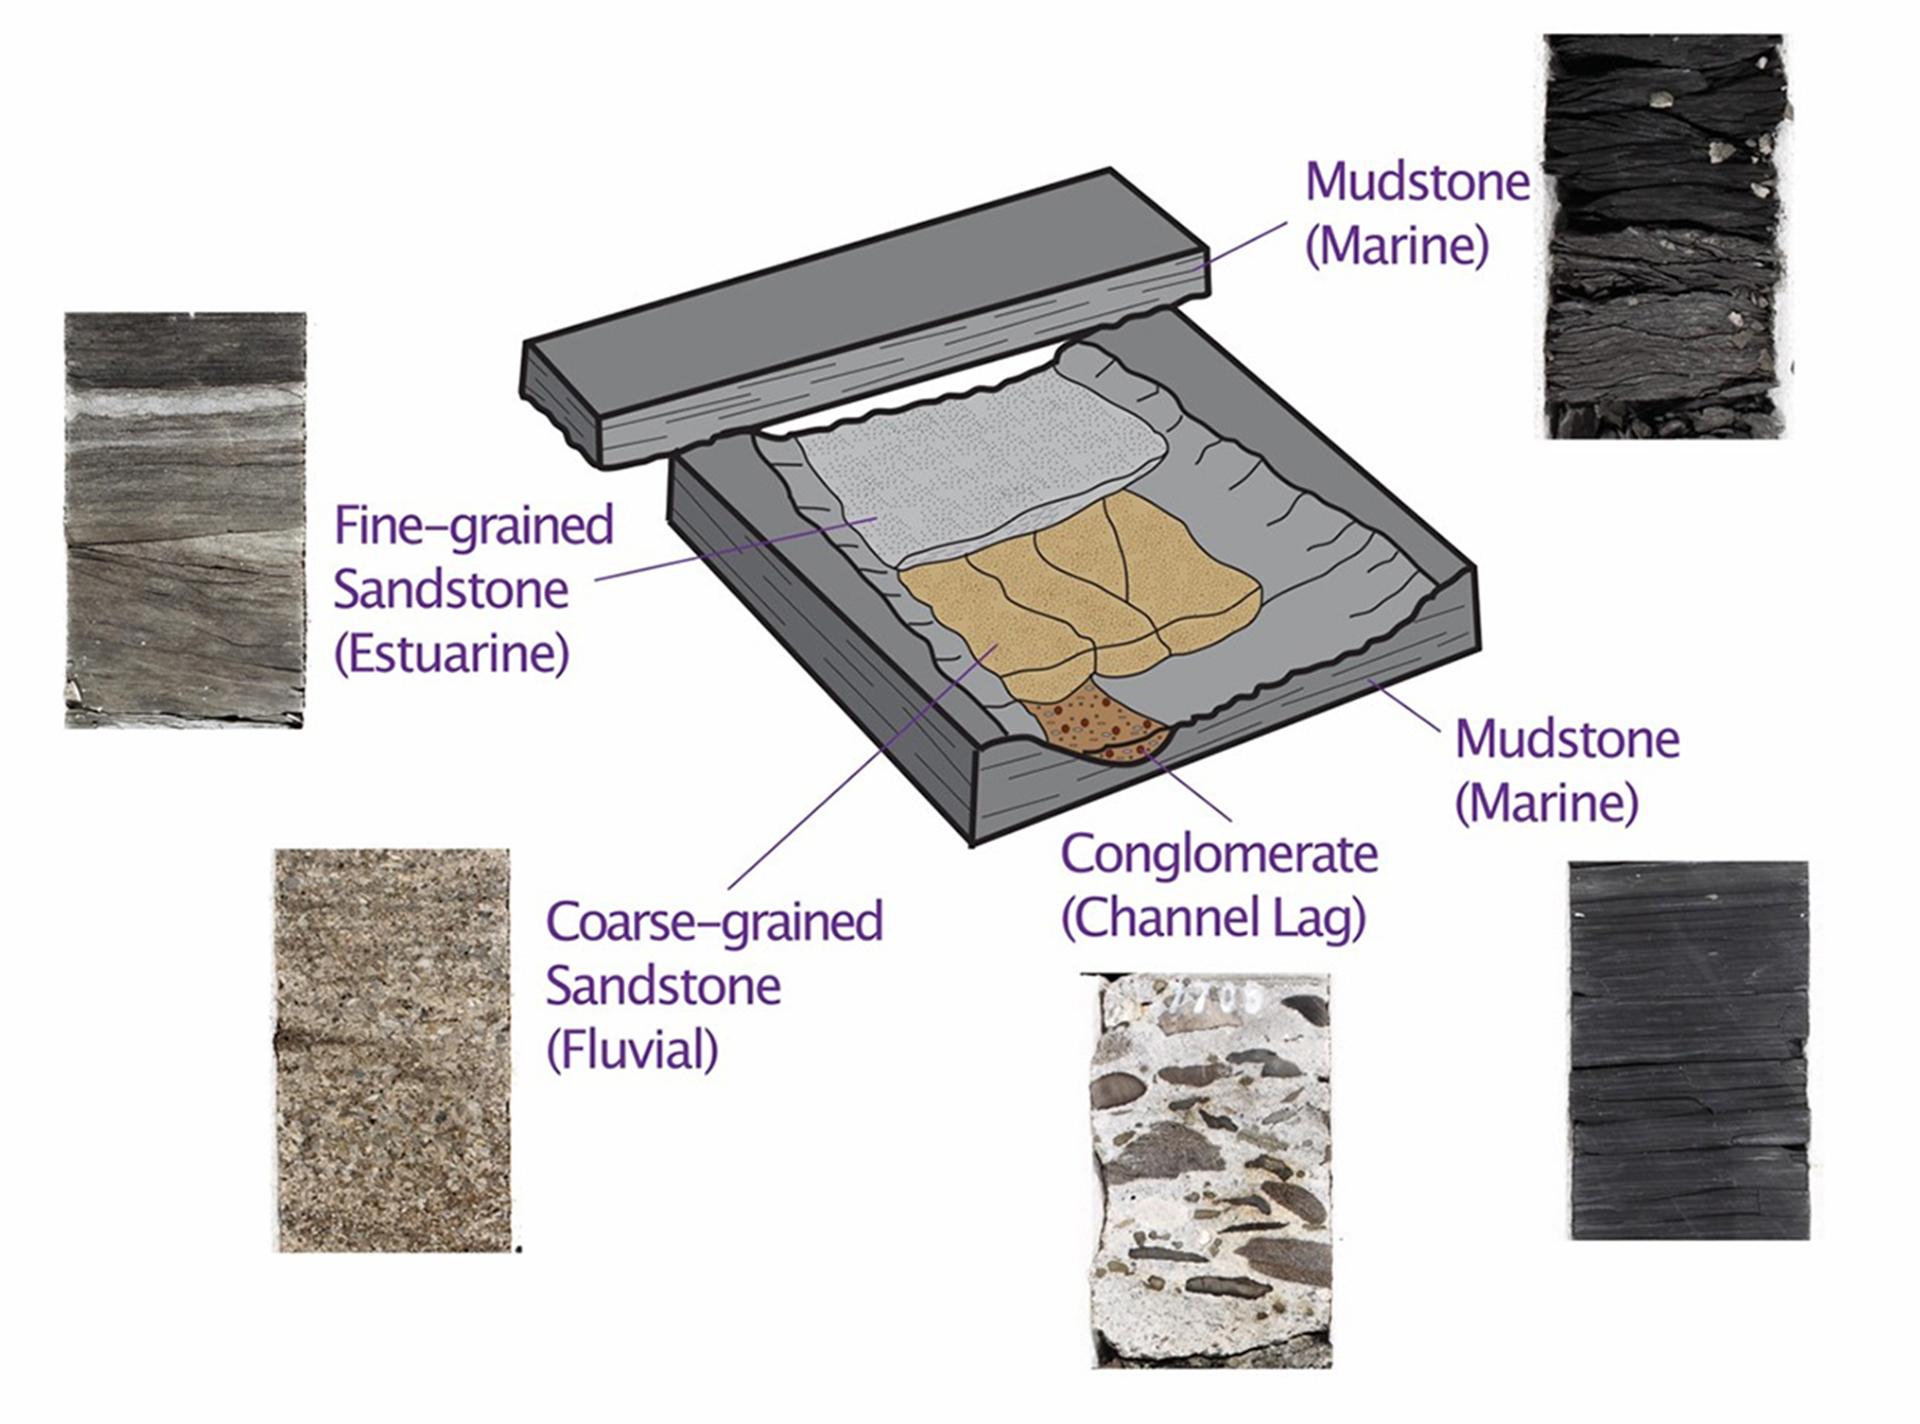
Figure 5: Generalized stratigraphy observed in all Morrow B and B1 cores. All core slabs in image are approximately 10 centimeters (approximately four inches) wide. Isochore maps of the Morrow B sand body at FWU show a feature 2.4 to 4.0 kilometers (1.5 to 2.5 miles) wide and a maximum of 18.3 meters (60 feet) thick.
Site Characterization
The Southwest Regional Partnership on Carbon Sequestration (SWP) conducted a thorough characterization of the Farnsworth Unit (FWU) field site using a variety of tools. SWP’s field partner provided more than 1,000 legacy logs from 181 wells, core analysis data from 50 wells, thin sections from six legacy wells, production and injection data, and a wealth of other field data. This rich legacy data set was amplified by several new data sets:
- Approximately 229 meters (~750 feet) of core from three new science wells that were drilled, logged, and cored for the project. Core included base to top of reservoir, plus large sections of overlying caprock.
- 3D seismic survey covering approximately 104 square kilometers (~40 square miles) of the FWU, legacy 2D lines tied to a 3D survey of another Morrow field several miles north, crosswell tomography between three pairs of wells, two large vertical seismic profile (VSP) surveys and several repeat surveys, and downhole and surface microseismic arrays.
- Detailed core descriptions of new and legacy cores. New cores had standard and advanced core analysis, detailed petrographic descriptions, X-ray diffraction (XRD) and microprobe analyses, fracture analysis, mechanical testing, total organic carbon (TOC), and more.
- Complete modern log suite, including borehole imagery and Elemental Analysis (ELAN) log analysis for the science wells.
- Baseline and repeat monitoring of water chemistry from groundwater wells in the area.
- Downhole pressure and temperature gauges (two memory and two real-time), as well as a fiber-optic distributed temperature sensor (DTS).
- Additional laboratory testing and experimental analysis that has yielded results such as rock mechanical moduli, failure characteristics, ultrasonic velocities under varying stress conditions, reservoir wettability and relative permeability, capillary pressure data, and chemo-mechanical behavior of reservoir rock in contact with carbon dioxide (CO2) under reservoir conditions.
These methods and technologies were chosen because SWP felt they would provide the most complete baseline picture of the reservoir that could be afforded on the project budget. While data provided by SWP’s partner were invaluable, they did not provide the resolution and granularity needed for the advanced simulations that were proposed.
Validated Technologies
Several technologies were valuable in the site characterization process, but one of the most useful techniques was the continual integration of geological and simulation models. An updated geological model was provided annually, with improvements reflected in the reservoir models used by several simulation models. A breakthrough in geological characterization was the classification of reservoir rocks into hydraulic flow units (HFUs) determined using the Winland R35 method. Rocks that are compositionally very similar could be classified by porosity-permeability relationships that reflect variations in pore size, shape, distribution, and interconnectivity (Figure 6*, Table 2). When these flow units are distributed throughout the field using geostatistical methods described below, this greatly improved simulation results. Moreover, detailed examination of varying flow units using thin section petrography, scanning electron microscopy, and computerized tomography (CT) scanning shows how the differences between the HFUs in pore and pore-throat size distributions and macro-pore connectivity show a textural basis for the measured permeability observed for the HFUs, and how the pore-to-core-scale heterogeneity is largely due to diagenetic processes operating on relatively minor compositional variations (Figure 7).
Use of HFUs for Porosity/Permeability 3D Geostatistical Interpolation: The method applied for property interpolation within the Morrow B was distinct from other formations due to availability of several legacy well porosity logs and the results of the well data HFU analysis described above. First, porosity logs were upscaled into the grid and interpolated through Gaussian co-simulation with seismic acoustic impedance supported by correlation of acoustic impedance and porosity in well logs. This interpolation resulted in the porosity distribution shown in Figure 8 (a). Next, the R35 logs were upscaled into the model grid and interpolated through Gaussian co-simulation with interpolated porosity supported by correlation in well logs. This resulted in the R35 distribution shown in Figure 8 (b). Then, HFU cutoffs were applied to the 3D Log35 property to create the 3D HFU (discrete) property model shown in Figure 8 (c). Lastly, the unique poro-permeability relationships were applied for each HFU to create the permeability distribution shown in Figure 8 (d).
* Note that figures referenced can be found on the right-hand margin of this section.
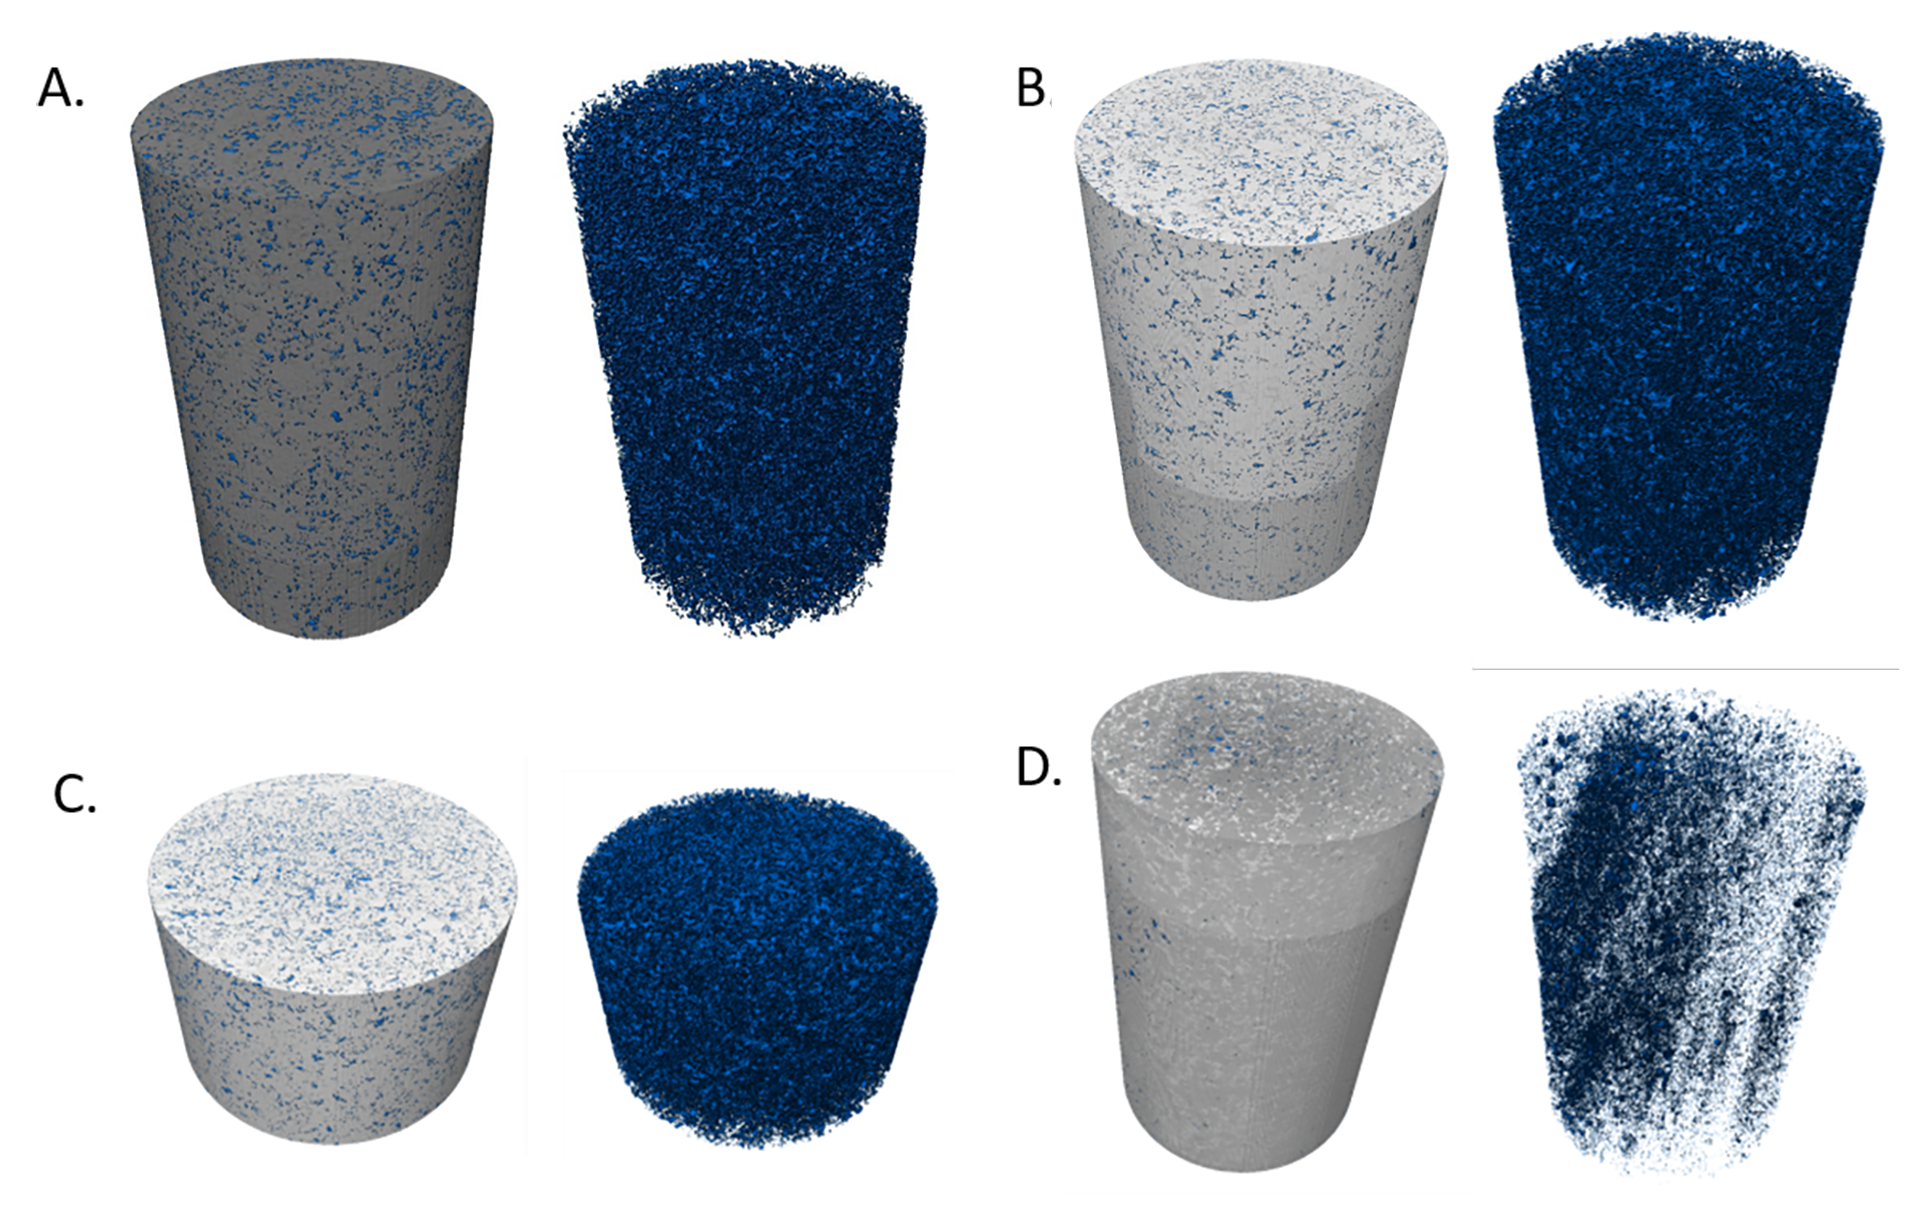
Figure 6: Absolute permeability–porosity relationships measured from Morrow B core plugs taken from well 13-10A at Farnsworth, delineated as per HFU definitions. The solid symbols denote core plug analyses from Terra Tek (now Schlumberger) using N2 gas as pore fluid (listed in Table 2). The ‘x’ symbols and adjacent numbers refer to samples used for relative permeability analyses, and refer to oil permeability determined at in situ conditions.
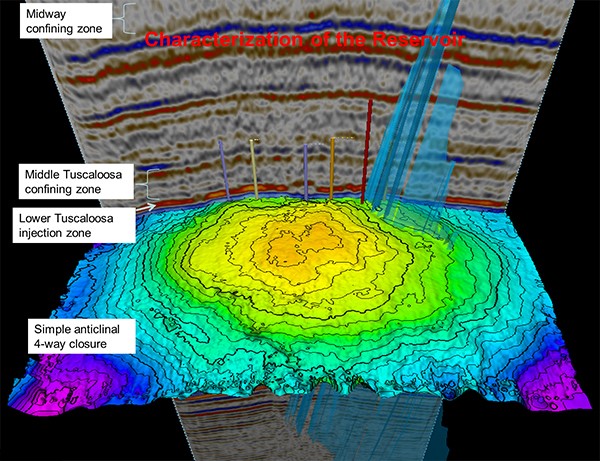
Figure 7: μCT reconstructions of full core scans at 31 μm × 31 μm × 31 μm voxel size that show porosity of the different HFU units (in blue). A. HFU V; B. HFU IV; C. HFU III; D. HFU I.
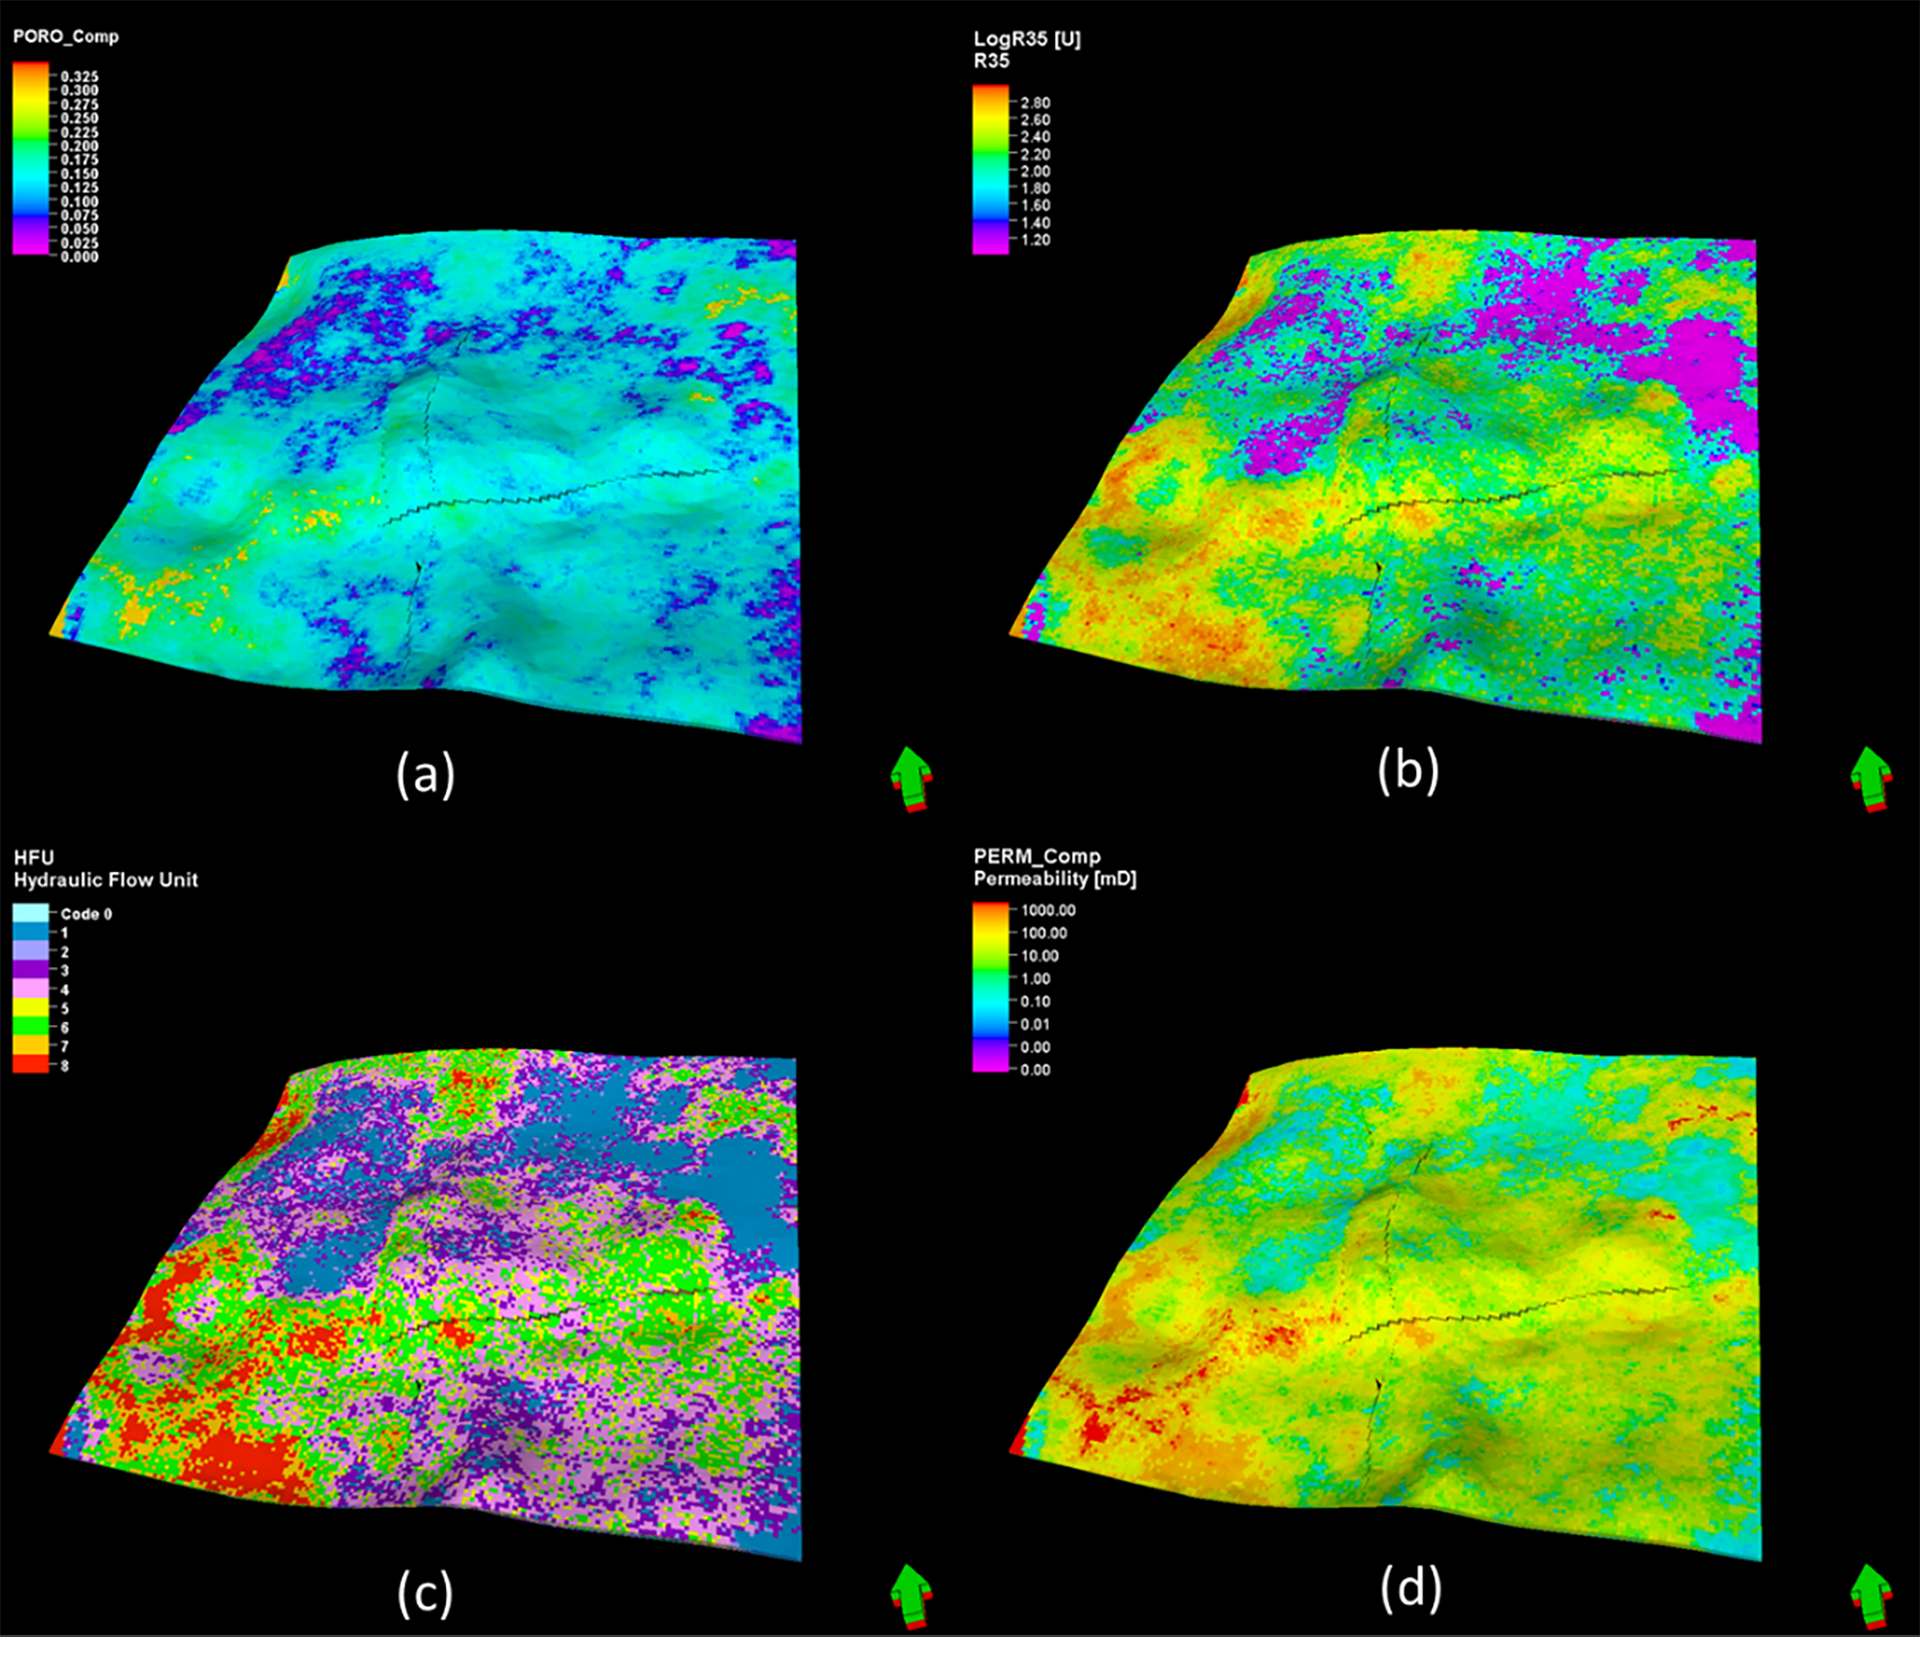
Figure 8: (a) Morrow B porosity distribution, (b) log R35 distribution, (c) HFU distribution, (d) permeability distribution.
| Hydraulic Unit | Pore Throat Size | Pore Type | Description |
|---|---|---|---|
| HFU I | Micro 0.25 µm-1.0 µm | Predominantly intragranular micro porosity | Intergranular porosity obstructed by carbonate cement |
| HFU II | Meso 1.0 µm-2.4 µm | Predominantly intragranular micro porosity | Coarse grained with lesser cement and increased amount of clay |
| HFU III | Macro 2.5 µm-4.7 µm | Intragranular micro with a greater amount of intragranular macro porosity, sparse intergranular micro and macro porosity | Poorly sorted medium grained with carbonate and clay cement |
| HFU IV | Macro 4.8 µm-10 µm | Intragranular micro and macro porosity as well as intergranular macro and micro porosity | Poorly sorted medium grained with carbonate and clay cement |
| HFU V | Mega > 10 µm | Intragranular micro and macro porosity, intergranular macro porosity | Coarse grained, moderately well sorted with relatively less cement |
Table 2: Core plug analyses.
Risk Assessment
The Southwest Regional Partnership on Carbon Sequestration (SWP) developed and applied a risk assessment workflow to the Farnsworth Unit (FWU) project that includes: (1) Risk Management Planning, (2) Risk Identification, (3) Qualitative Risk Analysis, (4) Quantitative Risk Analysis, (5) Risk Response Planning, and (6) Risk Monitoring and Control.
Using a feature, events, and processes (FEPs) approach, SWP assembled a risk registry that identified potential risks for all major activities of the project. SWP performed annual risk surveys starting in 2014 to evaluate and prioritize the FEPs. Risk was ranked semi-quantitatively with respect to event likelihood and impact severity. Both factors were judged on a five-point scale for each FEP. Significantly, rankings of the FEPs varied in different surveys. For instance, ranking of the FEP of price of oil was the 6th in 2014, but increased to the 1st in all following surveys, reflecting the large drop in oil price at the end of 2014. This drop caused the field operator to reduce expansion plans and ultimately resulted in the sale of the field to a new operator. Nevertheless, some FEPs remain in the top 10 for all surveys (e.g., carbon dioxide [CO2] supply adequacy and field operating and maintenance costs). Based on the results of the annual risk survey, SWP developed and regularly updated risk prevention and mitigation treatment plans for the top 40 FEPs.
SWP also acknowledged that project risk assessments will vary greatly depending on participants in the survey, as well as on the goals of a specific project. Risk to a research project might put more weight on obtaining good scientific results, whereas a commercial project would have more emphasis on financial viability.
Process influence diagrams (PIDs) were used to qualitatively identify interactions between the FEPs. In particular, SWP constructed PIDs in four areas, including CO2 storage, CO2-enhanced oil recovery (EOR), CO2 leakage, and geomechanical risk (see Figure 9*). Upon completing each risk survey, PIDs were constructed or updated accordingly. Selected top FEPs and their interactions were then evaluated to quantify associated risks. SWP’s recent quantitative risk analyses included:
-
Probabilistic risk assessment of CO2 trapping mechanisms at FWU.
-
Uncertainty analysis of CO2 storage and site performance at FWU.
-
Quantification of CO2-cement-rock interactions at the well-caprock-reservoir interface.
-
Assessment of potential chemical impacts of CO2 leakage on underground sources of drinking water (USDWs).
-
Forecasting evolution of formation water chemistry and long-term mineral alteration at FWU using laboratory experiments and geochemical modeling.
-
Investigation of arsenic mobilization mechanisms in shallow aquifers due to CO2 and brine intrusion.
SWP utilized a variety of numerical models and machine learning techniques for the quantitative risk assessment. Numerical models include 2D models for quick analysis and 3D models for comprehensive evaluation; two-phase (water/CO2) models for reactive transport and mineralization simulation and three-phase (hydrocarbon/water/CO2) models for CO2-EOR performance assessment; small-scale models for simulating geosystems adjacent to wellbores; and large-scale models for predicting the response of the entire reservoir. Machine learning techniques, specifically proxy models (or reduced-order models), were developed for FWU to provide efficient analysis on multiple risk factors, such as CO2 storage, CO2 leakage, and incremental oil production. Results of the quantitative risk analysis suggest that the injected CO2 is securely contained within the storage formation by a strong and resilient caprock, with nominal impact on any overlying aquifers, even if CO2 leakage from the reservoir did occur (see Figure 10).
Mercury porosimetry results were used to calculate CO2 column heights for the caprock and reservoir formations (see Figure 11). Caprock CO2 column height values are 1-to-2 orders of magnitude larger than the sandstone reservoir values and range from 1,000 to 10,000 meters (3,280 to 32,808 feet). Some samples reached the upper limit of pressure, 60,000 pounds per square inch (psi; 414 megapascals [MPa]), that the mercury injection capillary pressure (MICP) instrument was capable of sustaining with no intrusion of mercury.
* Note that figures referenced can be found on the right-hand margin of this section.
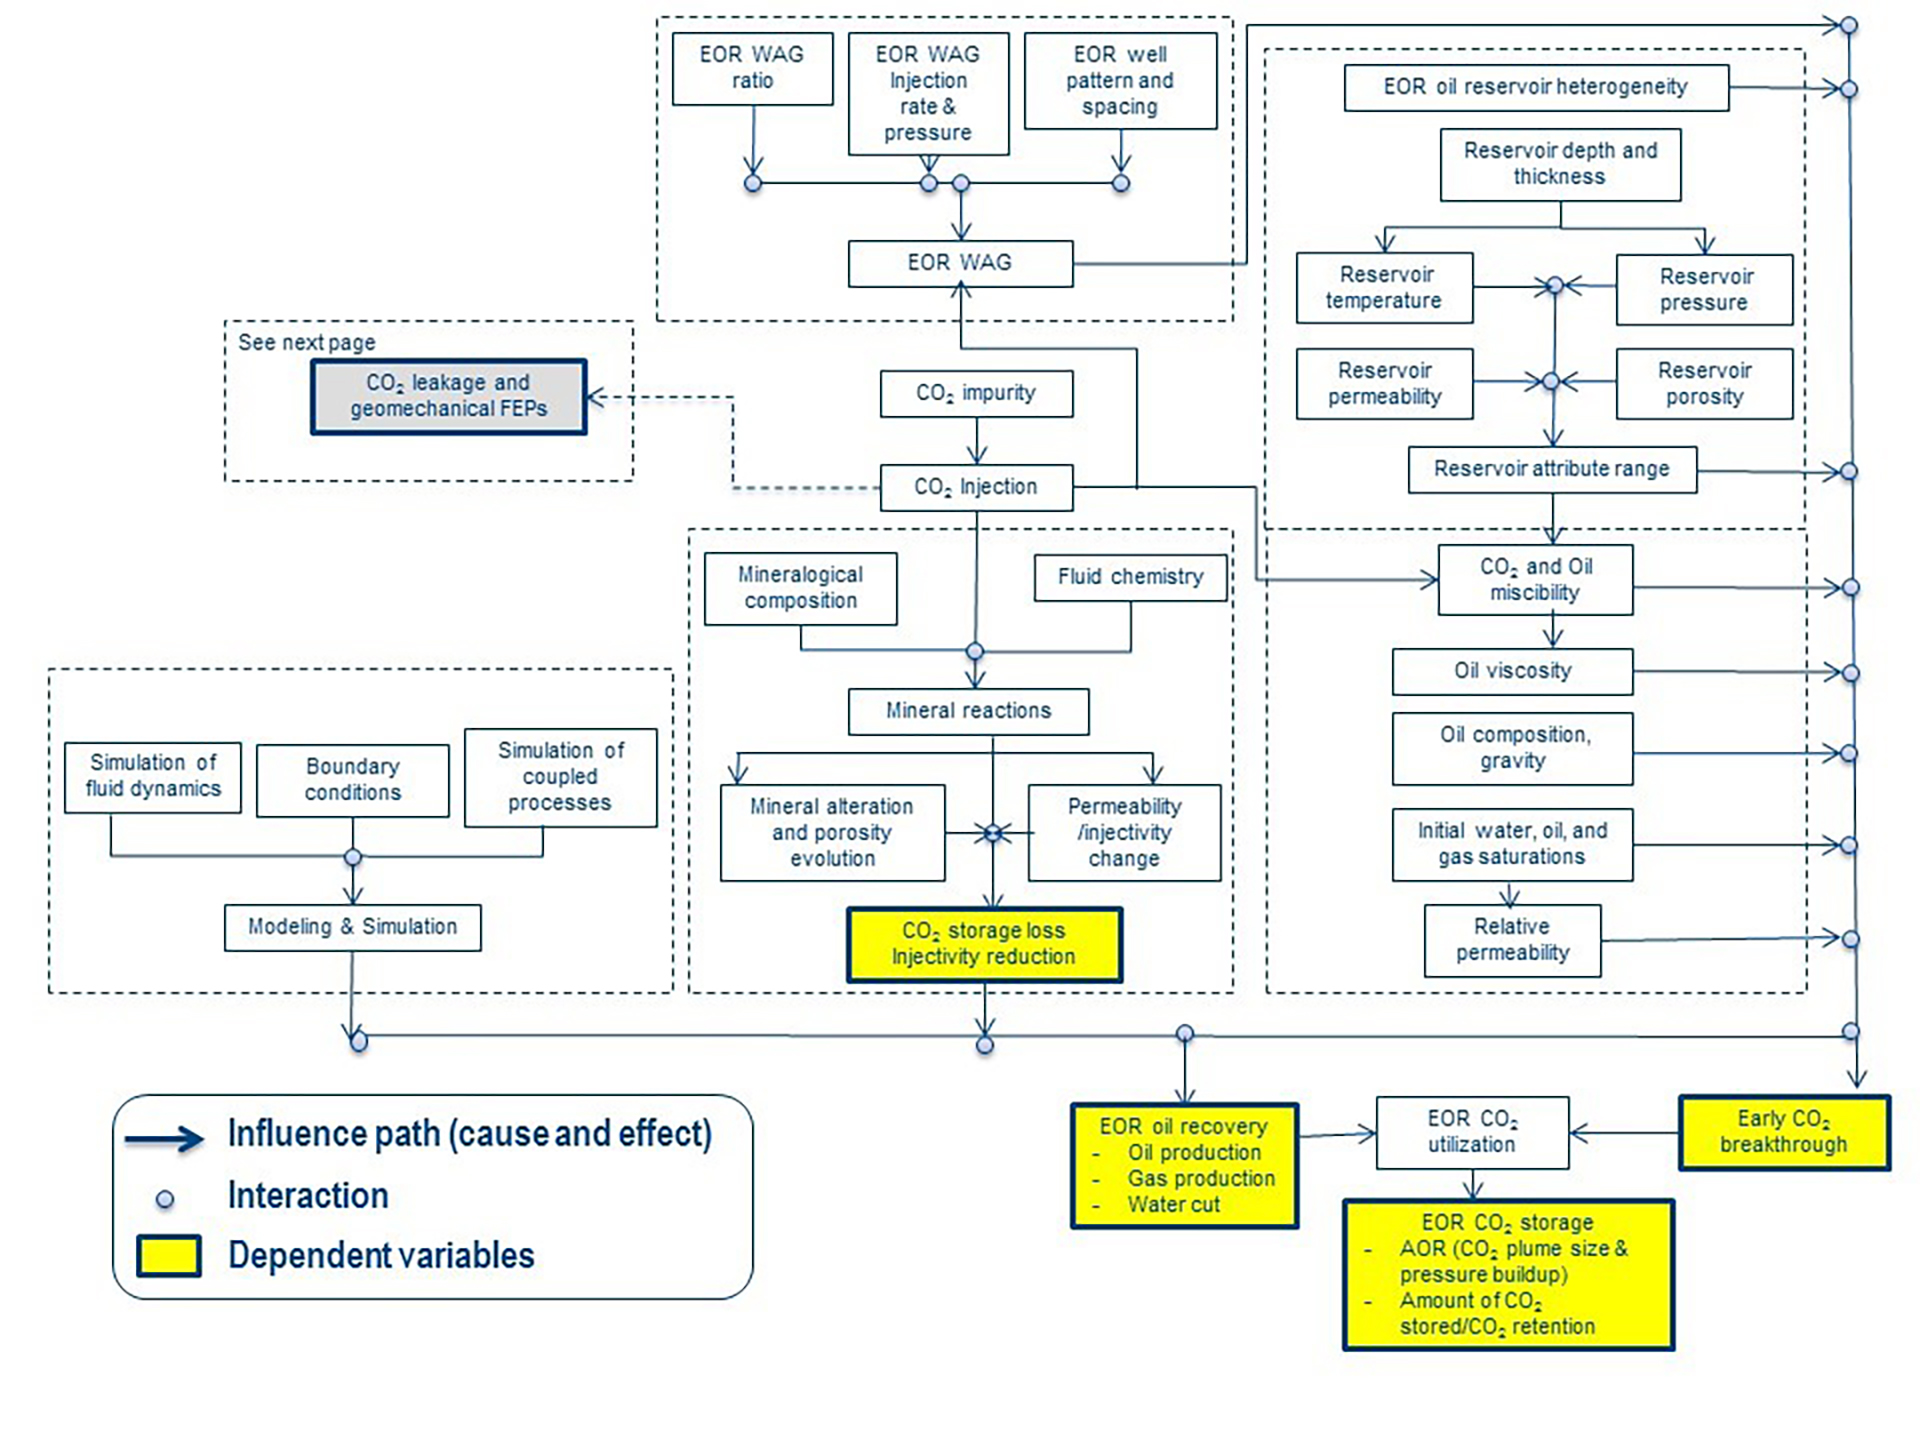
Figure 9: Process influence diagram for CO2 storage and CO2-EOR risks/FEP in SWP Farnsworth project. An arrow shows the influence path and each connection point is represented by a filled circle.
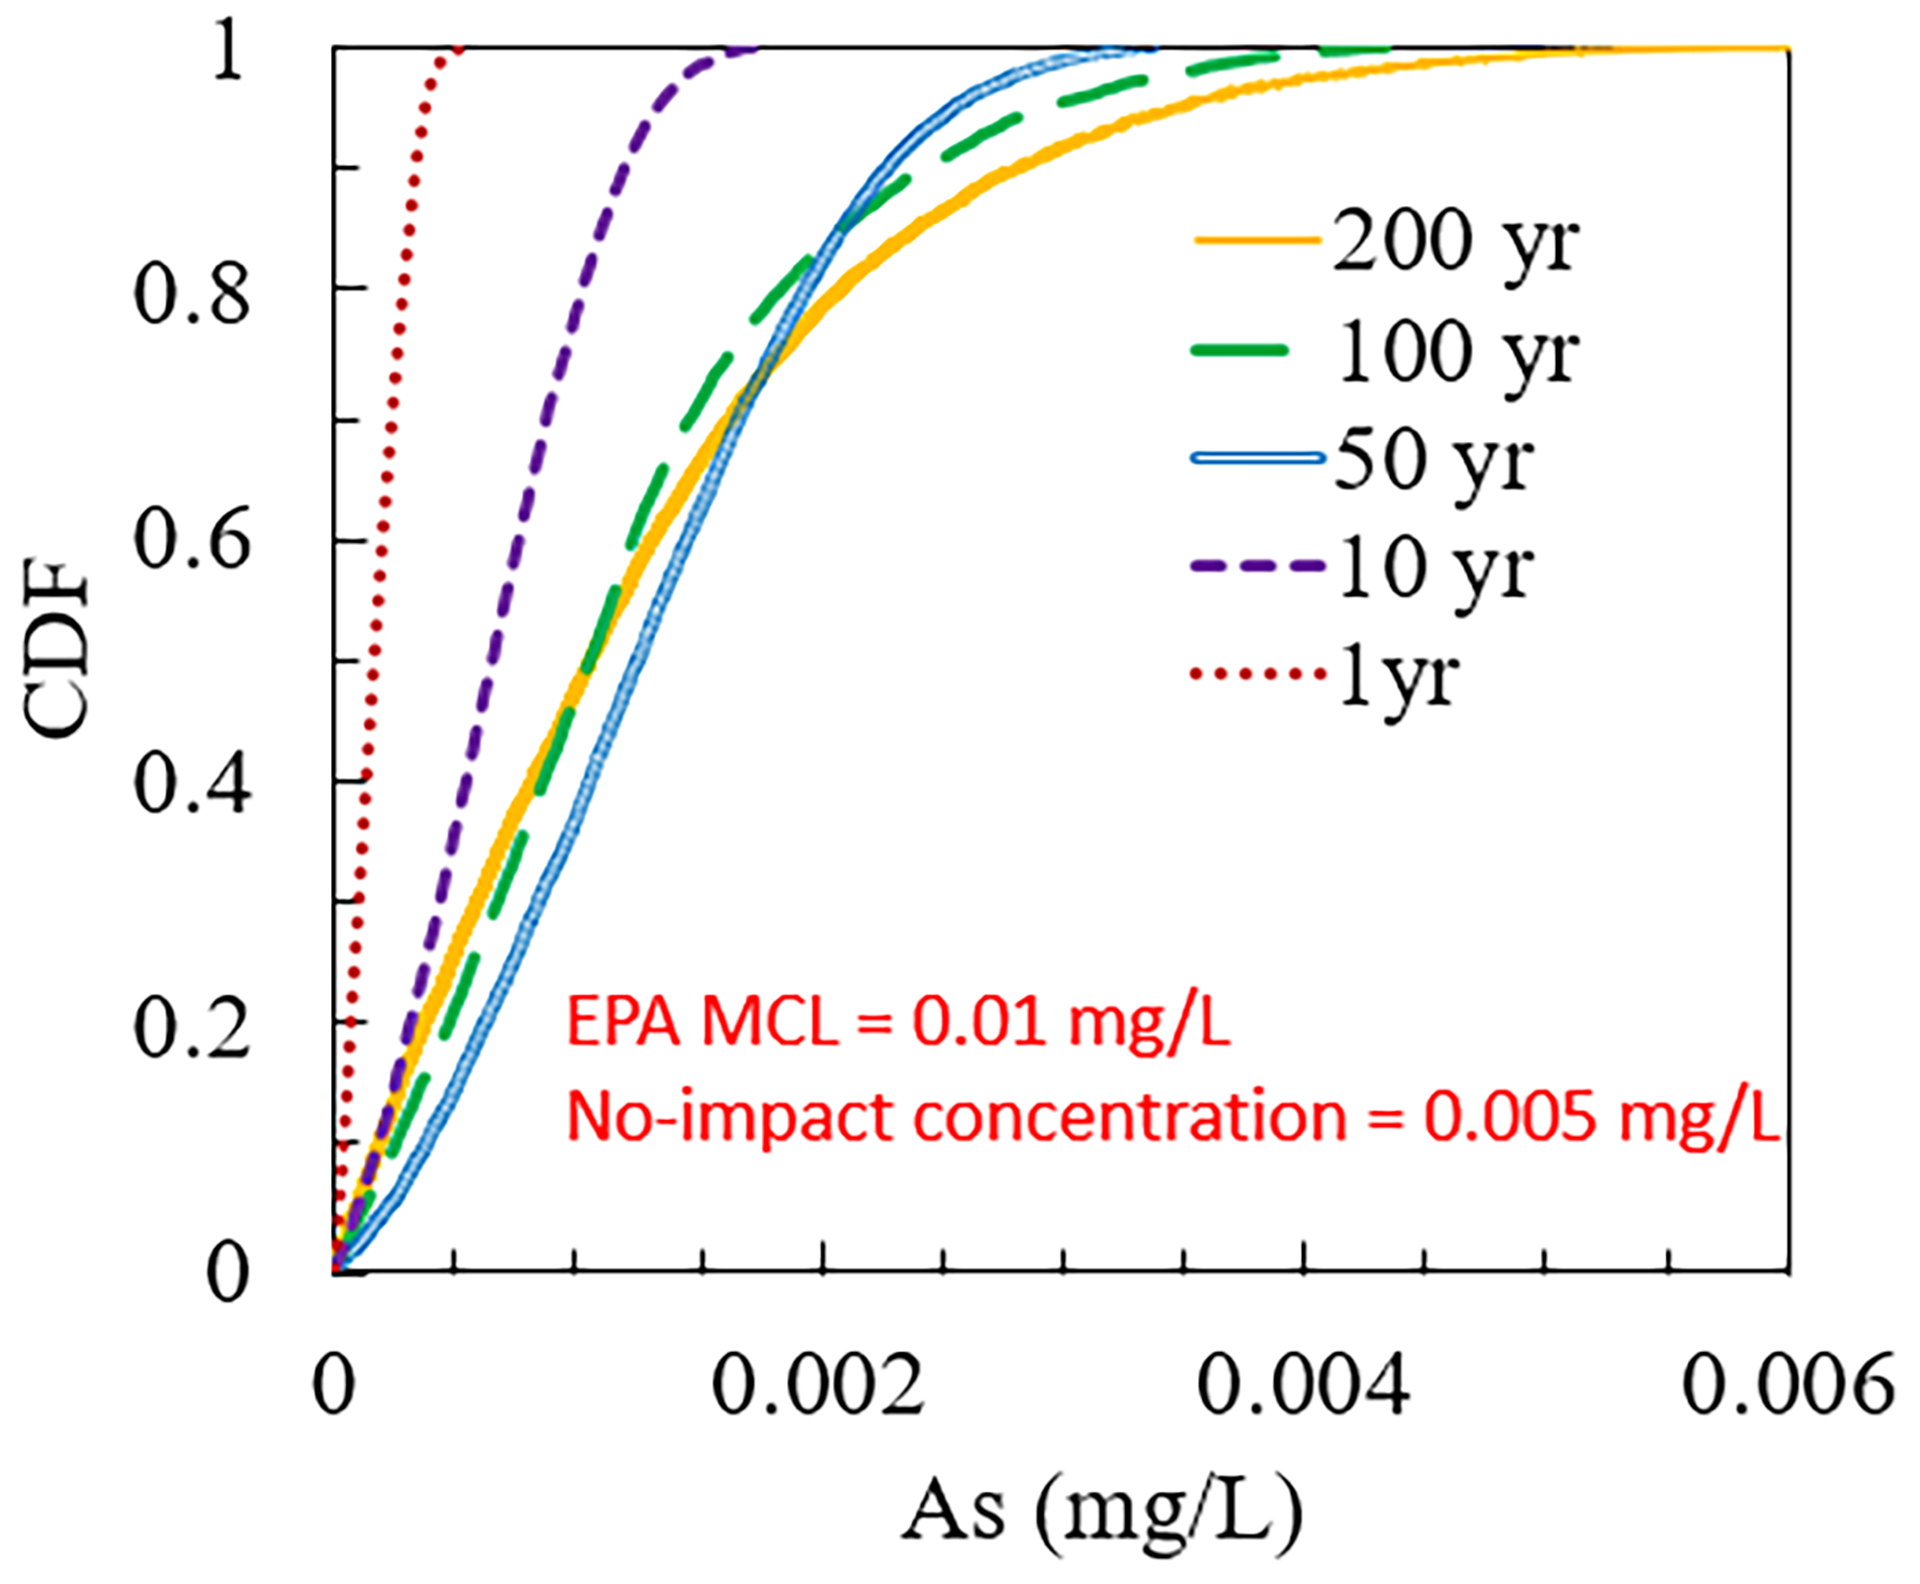
Figure 10: Cumulative distribution function of As concentration 1 meter (3.3 feet) away from the hypothetical leaky well.
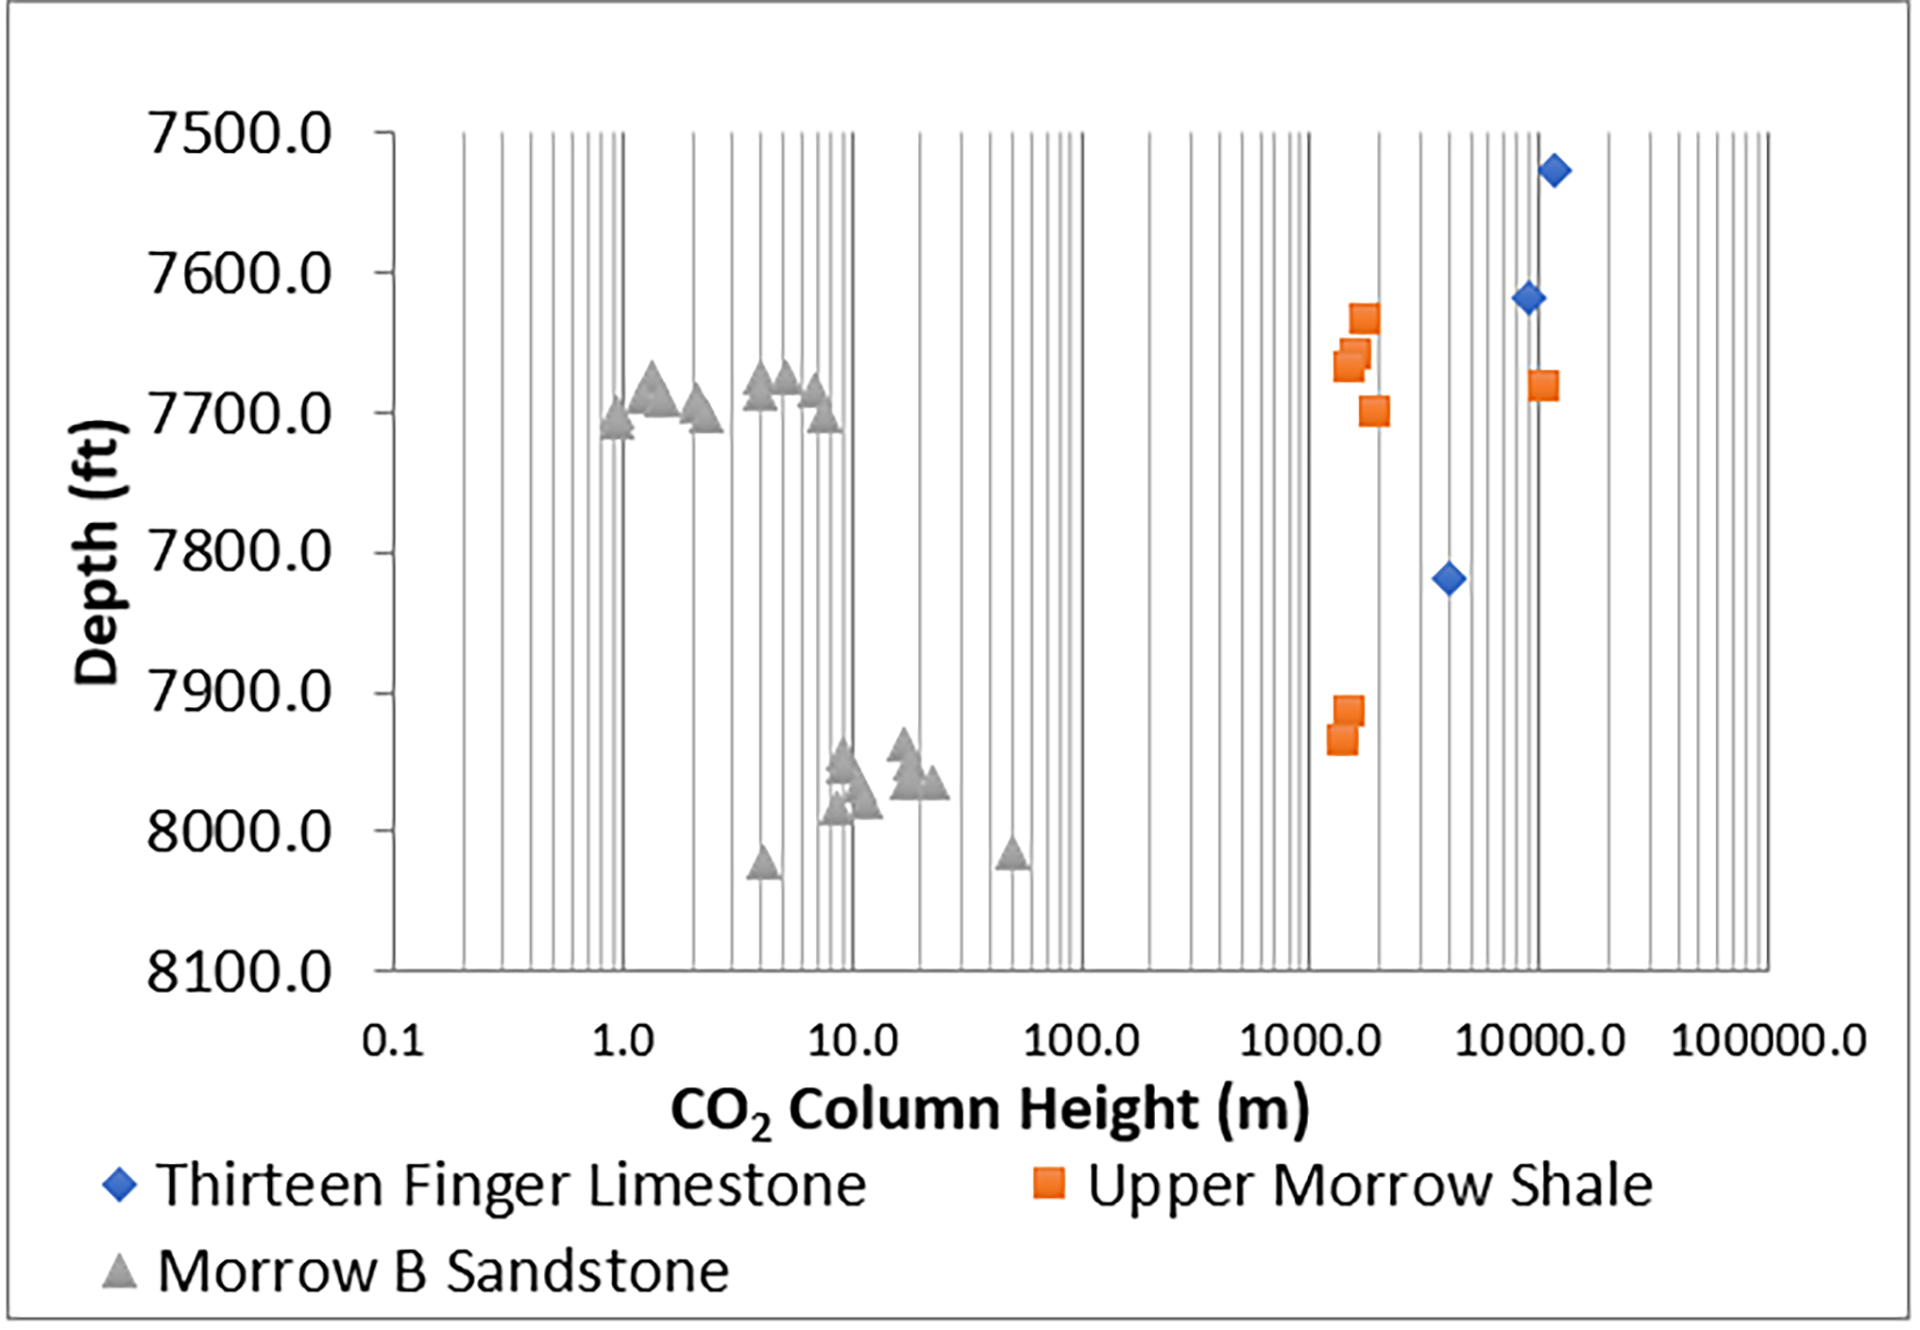
Figure 11: Seal capacity refers to the CO2 column height that the caprock can retain before capillary forces allow the migration of CO2 into the pore system of the caprock. Mercury intrusion breakthrough pressures are used to calculate CO2 column heights. The Upper Morrow shale immediately overlies the Morrow B reservoir and is the primary seal, along with the Thirteen Finger limestone. The Thirteen Finger is actually a unit of intercalated limestones and shales, and some of the limestones had breakthrough pressures exceeding the test limit of the MICP testing unit (60,000 psi).
MVA
The monitoring, verification, and accounting (MVA) program was designed to gather data necessary to characterize injected carbon dioxide (CO2) and in situ reservoir fluids, including volumes of CO2 injected, produced, and recycled; fluid dispersions; and identification and quantification of any potential migration of CO2 and/or fluids beyond the reservoir. Regular monitoring activities included underground sources of drinking water (USDW) groundwater wells for significant chemical changes (pH, major cations/anions, dissolved inorganic carbon [DIC], trace elements, isotopes), surface/atmospheric CO2 emissions, time-lapse seismic for CO2 plume assessment, microseismicity, and temperature/pressure with downhole sensors.
The following MVA tools were selected (click heading for more information on each tool:
Quarterly analyses from at least 16 shallow household and irrigation wells in and around the Farnsworth Unit (FWU) field site indicated that no reservoir fluids (CO2, brine, hydrocarbons) have infiltrated the Ogallala aquifer. Some of the wells did exhibit gradually increasing concentrations of DIC, but these are not accompanied by any changes in pH, alkalinity, or other typical indicators of CO2 infiltration, suggesting other factors at play (e.g., groundwater recharge).
The Southwest Regional Partnership on Carbon Sequestration (SWP) has used vapor-phase and aqueous-phase tracers since 2014, in multiple five-spot patterns in the field, to better understand fluid migration. Significantly, injected tracer recovery (rate and volume) for a given pattern is highly dependent on reservoir heterogeneity, often indicating the presence of high permeability pathways, possibly faults, fractures, or facies changes.
Three 3D baselines surveys were acquired pre-injection for three wells, and three 3D repeat surveys at different periods of injection were acquired for an injection well. Researchers hoped the VSP data would provide more accurate imaging of both reservoir and caprock, which are thinner than the resolution of the 3D survey. VSP also allows for the evaluation of changes in seismic response that could be caused by fluid changes within an injection zone.
The higher frequency of crosswell surveys allows for superior imaging of the subsurface; integrated with surface seismic and VSP data, it could potentially reduce uncertainty in time-lapse attribute analyses and delineating of subsurface structures.
To detect events caused by injection or drawdown, downhole geophones were deployed in an observation well and surface seismometers were installed at locations determined by modeling the survey design. The two measurements were integrated to enhance accuracy of determination of depth and location of potential microseismic events.
Two memory gauges were installed in an injection well and two real-time downhole gauges were installed in an observation well. Data were examined to monitor pressure and temperature changes from injection and drawdown.
To monitor caprock and well integrity, fiber-optic cable was installed along the borehole of the observation well and can detect any abnormal temperature changes that could be caused by leakage.
The MVA program at FWU provided accurate simulations and risk assessment, particularly for USDWs in the regionally significant Ogallala groundwater aquifer. The Southwest Regional Partnership on Carbon Sequestration (SWP) also wanted to evaluate the viability of different monitoring technologies for commercial and technical usefulness, with the most successful technologies to be recommended for implementation in future commercial-scale carbon capture and storage (CCS)/carbon capture, utilization, and storage (CCUS) projects.
Key results of the MVA program at FWU include:
- VSP is proven to be an effective method for time-lapse monitoring, although adequate time between injection and repeat surveys must be allowed to resolve volumetric changes.
- Crosswell seismic can provide a high-resolution image of the subsurface; however, for successful monitoring, both source and receiver arrays must penetrate injection zones.
- Combined surface and downhole microseismic monitoring yields more accurate depth and location of microseismic events
- Tracer testing shows the probable existence of fast paths within the reservoir, but results can be difficult to interpret. Vapor-phase tracers seem particularly susceptible to sampling artifacts and interpretation difficulties.
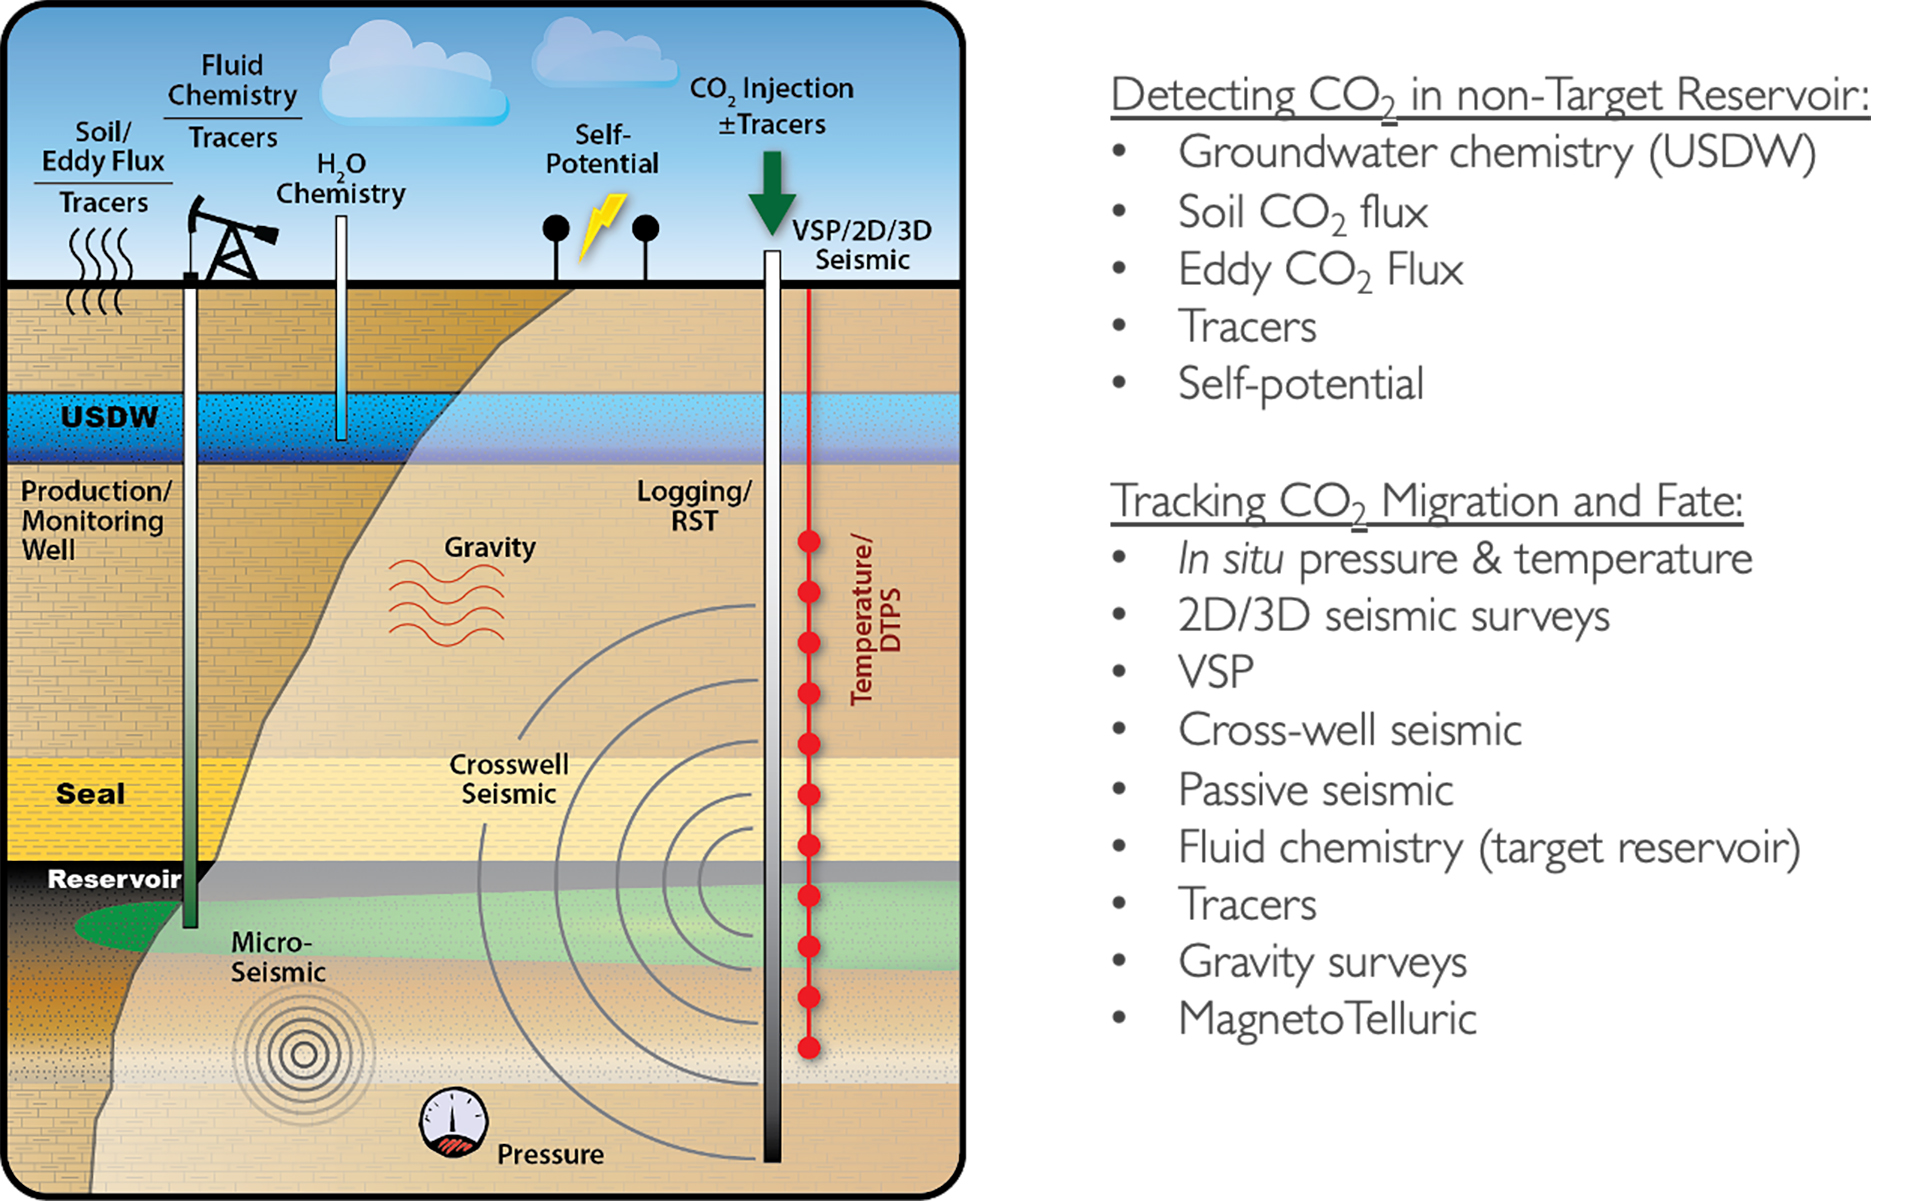
Figure 12: MVA methods used at Farnsworth Unit field site.
SWP Resources
It is impossible to list all the work published by the Southwest Regional Partnership on Carbon Sequestration (SWP), even for Phase III. SWP selected some of the most important or useful references for each of the working groups, which are listed below. A more complete list can be found on SWP’s website, or by searching on individual researcher names.
Risk
-
Dai, Z., Viswanathan, H., Middleton, R., Pan, F., Ampomah, W., Yang, C., & Balch, R. (2016). CO2 accounting and risk analysis for CO2 sequestration at enhanced oil recovery sites. Environmental science & technology, 50(14), 7546-7554.
-
Pan, F., McPherson, B. J., Dai, Z., Jia, W., Lee, S. Y., Ampomah, W., & Esser, R. (2016). Uncertainty analysis of carbon sequestration in an active CO2-EOR field. International Journal of Greenhouse Gas Control, 51, 18-28.
-
Xiao, T., McPherson, B., Pan, F., Esser, R., Jia, W., Bordelon, A., & Bacon, D. (2016). Potential chemical impacts of CO2 leakage on underground source of drinking water assessed by quantitative risk analysis. International Journal of Greenhouse Gas Control, 50, 305-316.
-
Xiao, T., McPherson, B., Bordelon, A., Viswanathan, H., Dai, Z., Tian, H., ... & Carey, W. (2017). Quantification of CO2-cement-rock interactions at the well-caprock-reservoir interface and implications for geological CO2 storage. International Journal of Greenhouse Gas Control, 63, 126-140.
Simulation
-
Ahmmed B, Appold MS, Fan T, McPherson BJ, Grigg RB, White MD (2016) Chemical effects of carbon dioxide sequestration in the Upper Morrow Sandstone in the Farnsworth, Texas, hydrocarbon unit. Environ Geosci 23(2):81–93.
-
Ampomah, W., Balch, R., Cather, M., Rose-Coss, D., Dai, Z., Heath, J., Dewers, T. and Mozley, P., 2016. Evaluation of CO2 storage mechanisms in CO2 enhanced oil recovery sites: Application to Morrow sandstone reservoir. Energy & Fuels, 30(10), pp.8545-8555.
-
Ampomah, W., Balch, R.S., Cather, M., Will, R., Gunda, D., Dai, Z. and Soltanian, M.R., 2017. Optimum design of CO2 storage and oil recovery under geological uncertainty. Applied Energy, 195, pp.80-92.
-
Ampomah, W., Balch, R., Grigg, R.B., Cather, M., Gragg, E., Will, R.A., White, M., Moodie, N. and Dai, Z., 2017. Performance assessment of CO2-enhanced oil recovery and storage in the Morrow reservoir. Geomechanics and Geophysics for Geo-Energy and Geo-Resources, 3(3), pp.245-263.
-
Moodie, N., Ampomah, W., Jia, W., Heath, J. and McPherson, B., 2019. Assignment and calibration of relative permeability by hydrostratigraphic units for multiphase flow analysis, case study: CO2-EOR operations at the Farnsworth Unit, Texas. International Journal of Greenhouse Gas Control, 81, pp.103-114.
Monitoring, Verification, and Accounting (MVA)
-
Balch, R.S., Will R., El-Kaseeh G., Grigg R.B., Hutton A., and Czoski P. (2015) Integrating Multi-Scale Seismic Measurements for EOR/CCUS. SEG Annual Meeting, Oct. 18-23, 2015, New Orleans, Louisiana. DOI http://dx.doi.org/10.1190/segam2015-5919900.1
-
Robert Balch, Richard Esser, and Ning Liu, "Monitoring CO2 at an enhanced oil recovery and carbon capture and storage project, Farnsworth unit, Texas" in "CO2 Summit II: Technologies and Opportunities", Holly Krutka, Tri-State Generation & Transmission Association Inc. Frank Zhu, UOP/Honeywell Eds, ECI Symposium Series, (2016). http://dc.engconfintl.org/co2_summit2/30
-
Coutinho L., (2017) Analysis of near-surface and atmospheric monitoring results from the enhanced oil recovery and storage project at Farnsworth Unit, Texas M.S. thesis, New Mexico Tech.
-
El-Kaseeh G, Will R., Balch R.S., and Grigg R.B. (2016) Multi-Scale Seismic Measurements for CO2 monitoring in EOR/CCUS Project. Greenhouse Gas Control Technologies 13, Nov. 14-18, Lausanne, Switzerland.
-
White M.D., Esser R.P., McPherson B.J., Balch R.S., Liu N., Rose P.E., Garcia L., and Ampomah W. (2017) Interpretation of Tracer Experiments on Inverted Five-Spot Well-Patterns within the Western Half of the Farnsworth Unit Oil Field. Energy Procedia, V. 114, p. 7070-7095. https://doi.org/10.1016/j.egypro.2017.03.1849
Characterization
-
Balch R.S, and Will R. (2015) Subsurface Characterization and Seismic Monitoring for the Southwest Partnerships Phase III Demonstration Project at Farnsworth Field, TX. American Geophysical Union Fall Meeting. Dec. 14-18, 2015, San Francisco, CA. https://agu.confex.com/agu/fm15/meetingapp.cgi/Paper/74547
-
Gunda, D., Ampomah, W., Grigg, R., & Balch, R. (2015, November 17). Reservoir Fluid Characterization for Miscible Enhanced Oil Recovery. Carbon Management Technology Conference. doi:10.7122/440176-MS
-
Rasmussen, L., Fan, T., Rinehart, A., Luhmann, A., Ampomah, W., Dewers, T., Heath, J, Cather, M., and Grigg, R. (2019). Carbon Storage and Enhanced Oil Recovery in Pennsylvanian Morrow Formation Clastic Reservoirs: Controls on Oil/Brine and Oil/CO2 Relative Permeability from Diagenetic Heterogeneity and Evolving Wettability. Energies 2019, 12(19), 3663; https://doi.org/10.3390/en12193663
-
Rose-Coss, D., Ampomah, W., Cather, M., Balch, R.S., Mozley, P. and Rasmussen, L., 2016, May. An improved approach for sandstone reservoir characterization. In SPE Western Regional Meeting. SPE-180375-MS. https://doi.org/10.2118/180375-MS
-
Wu, Z., Luhmann, A. J., Rinehart, A. J., Mozley, P. S., Dewers, T. A., Heath, J. E., & Majumdar, B. S. (2020). Chemo‐mechanical alterations induced from CO2 injection in carbonate‐cemented sandstone: An experimental study at 71 °C and 29 MPa. Journal of Geophysical Research: Solid Earth, 125, e2019JB019096. https://doi.org/10.1029/2019JB019096