
Business

Business
This dashboard represents select gas turbines operating within the United States that were installed since 1999. Legacy power plant units (1998 or earlier) are generally excluded. Details on how the data is sourced and treated are discussed on this page.
The NETL turbine installation map tool contains data for new turbine installations from 1999 to 2024. The primary information source for these turbines is generator level data from the U.S. Energy Information Administration (EIA) monthly 860 reports, and electricity generation data from the EIA 923 reports (up to December 2024). Additional installations were added based on information from the 2024 Gas Turbine World Handbook. Entries were organized based on the EIA’s plant ID and generator ID for unique identifiers. Entries from sources other than the EIA were given unique identifiers based on the primary source of the data. For convenience, only turbines within the continental U.S., Hawaii and Alaska were considered (i.e., no offshore units and no units in U.S. territories or other countries). Historical data is provided by past EIA monthly 923 reports going back to 2014.
Other items available on the map include CO2 and hydrogen ( H2) pipelines and other hydrogen infrastructure/hubs. For the CO2 pipeline and H2 hydrogen data, several sources were consulted. Hydrogen pipeline locations were found using a report from the Congressional Research Service. This information was cross-referenced with information from the National Renewable Energy Laboratory’s (NREL’s) Hydrogen Demand and Resource Analysis (HYDRA) Tool. More information about this tool can be found here. CO2 pipeline locations were gathered from another interactive map from the Pipeline and Hazardous Materials Safety Administration (PHMSA).
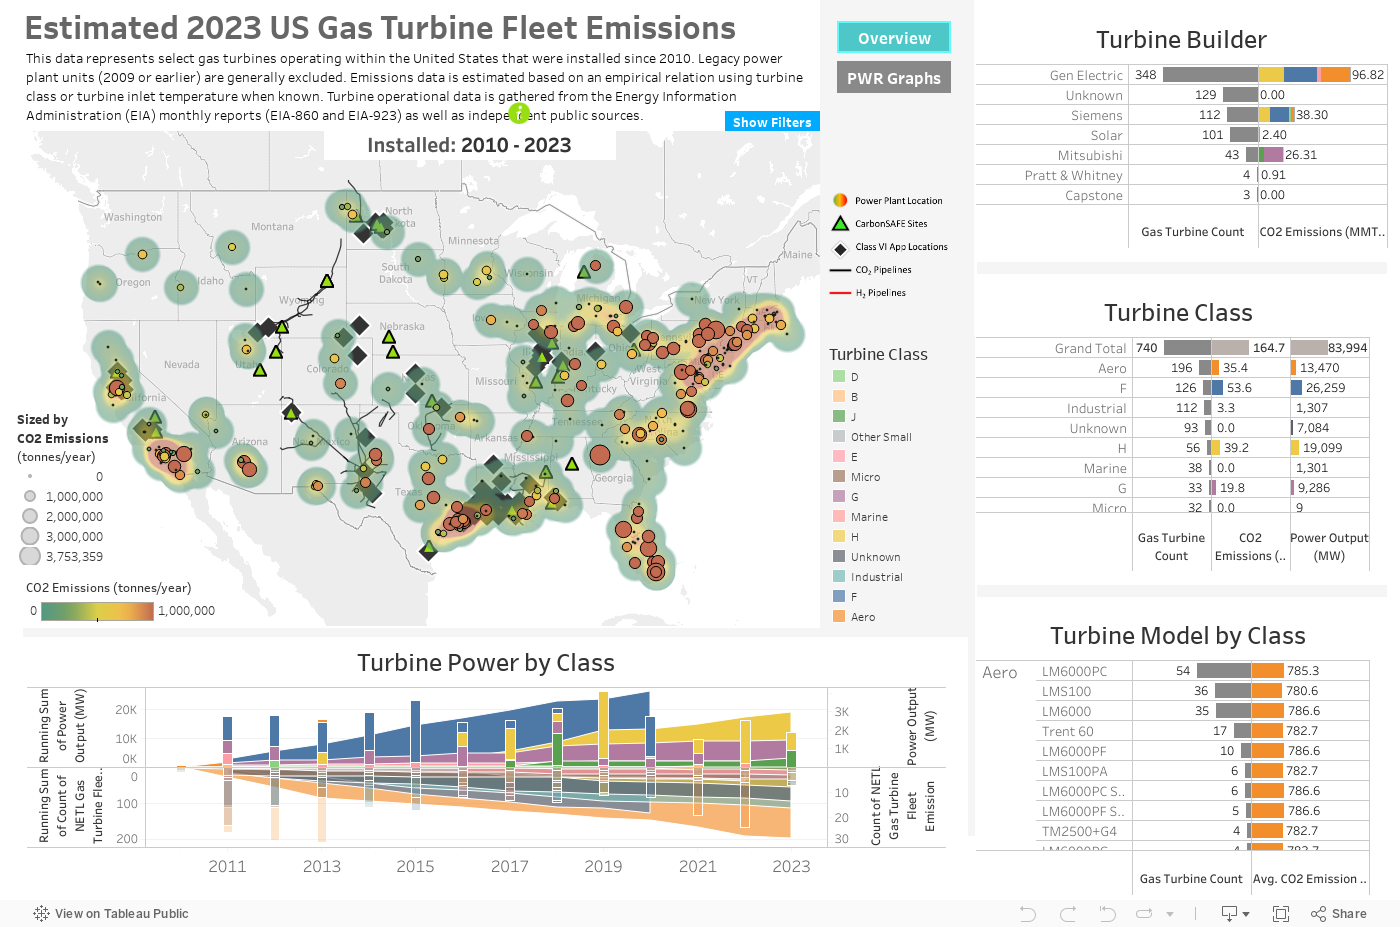
The efficiency dashboard covers the complete dataset, with all known turbine installations as listed in the EIA-860 data. The dashboard includes an interactive map that shows the locations of the individual units and visual representations of the power outputs and carbon efficiencies of the plants on record. Specific data on various manufacturers and turbine classes is also included. The class list can be expanded to show individual models of turbines by clicking on the “+” sign on the top left of the chart. Finally, an installation timeline below the map shows a running tally of the total power output and number of units of each turbine class installed over the years dating back to 1999. On the bottom of the dashboard are several treemap charts that can be adjusted depending on the user’s selections. The user can also adjust the data range using the slider on the bottom left side of the map itself or clicking on different map or table items to filter the display (e.g., showing only installations from certain manufacturers or certain turbine firing classes). Selections can be cancelled by clicking the selected item a second time.
The power dashboard displays various charts that show the total power capacity that gas turbine installations added to the grid each year. The user can adjust the date range and the midpoint year using the sliders provided at the top of the dashboard. As with the efficiency dashboard, the rows of the turbine class chart can be expanded to show individual models by clicking the “+” sign that appears on hover-over. In addition, users can filter the data by clicking on individual chart items. Filters can be removed by clicking on the selected items a second time. Finally, a treemap showing plants installed prior to and after the midpoint year can be seen beneath the charts.
The utilization dashboard demonstrates the change in overall plant capacity factors over the years going back to 2014, based on the available data from the EIA-923 reports mentioned above. The user can select individual years to see turbines that operated during a specific year using the selector above the map. As with the other dashboards, users can click individual plants on the map, as well as various items on the surrounding charts, to narrow down the data further. Selections can be cancelled by clicking selected items a second time. The surrounding charts show the annual capacity factors and unit counts for the selected year as well as a capacity factor matrix showing the aggregated data for the various Federal Energy Regulatory Commission regions (for turbines of different firing classes and builders). Below the map is a timeline chart showing the total net energy generation for the selected data across each month for the entire date range. Finally, like the previous dashboards, sortable treemap diagrams are available at the bottom of the dashboard.
The historical dashboard is similar to the utilization dashboard, but it allows users to compare the turbine fleet’s operating capabilities of different years and compare the capacities and net energy generated between different years. The user can select two years for comparison using the selector at the top of the dashboard. (The year on top is assumed to be the “start” year, while the year on the bottom is the “end” year.) This dashboard’s displays and capabilities are otherwise the same as those of the capacity dashboard.
The EIA data mentioned above was generally taken to be the original source for installations. Plants whose existence and/or completion status could not be verified and plants that were confirmed to have been demolished or cancelled were ignored for the purpose of generating the dataset. As the EIA does not have information on the gas turbine firing class or operating data, such information was taken from either Gas Turbine World or an independent source (see below).
To ensure the accuracy of the dataset, all entries (plus some tentative projects still under construction) were cross-referenced with information from the Power Technology database and the Global Energy Monitor Wiki. In cases where the original EIA data is directly in question and to avoid circular reference issues, GEM Wiki was not used. (GEM Wiki’s primary information source is often past EIA reports.) In cases where discrepancies were found between these primary sources, information from independent sources, provided for each entry where appropriate in the Tableau engine and accompanying spreadsheet, was used instead. (For example, in the EIA entry “Jack McDonough,” with plant ID 710, the actual name of the plant as recorded by the owners is the “McDonough-Atkinson Power Plant,” so this is the name used for the map tool. Another example: for Brea Power II LLC’s plant, with plant ID 58007, the EIA lists this as the “Brea Expansion Plant.” This is part of the “Brea Power Project,” and it is a unit installed at the Olinda-Alpha Landfill. Thus, “Olinda-Alpha Landfill” is the name used. Other items, such as owner rebrandings, transfers of ownership, and other such recent changes not captured by the EIA were noted and changes were made appropriately as discovered). In general, any information taken from independent sources, especially turbine original equipment manufacturers (OEMs) and plant owners, is treated as the most accurate. Turbine spec and operability data was gathered from Gas Turbine World and verified in a similar fashion with spec data from OEMs where available. Plant location data was taken from coordinates provided by the EIA and verified using Google Maps.
The primary method of determining the overall CO2 emissions of any given engine is based on the calculation of the engine’s “carbon efficiency” (CE). The CE values were calculated based on the OEM-specified heat rate (in Btu/kWh, calculated based on lower heating value) and fuel CO2 potential (in lb CO2/MMBtu), as described in equation 2.
\[ \textit{Carbon Efficency (CE)} = \frac{\textit{Heat Rate} \times \textit{Fuel CO}_2 \textit{ Potential}}{1000} \]
Eq. 1
Here, the conversion factor of 1,000 is used to convert the units in the denominator from MMBtu to Btu by dividing by 1 million and from kWh to MWh by multiplying by 1 thousand (1,000/1,000,000 = 1/1,000). This yields the unit-specific carbon efficiency in terms of lb CO2/MWh. This method is representative of real engines operating under International Standards Organization conditions. In most cases, the fuel CO2 potential was taken from the EIA (where it is referred to as Carbon Dioxide Emissions Coefficient). For syngas and landfill gas, the CO2 potential was calculated based on a representative blend of gases based on several past published datasets as an overall “average.” For syngas, the representative blend chosen was 33% H2, 16% CO2, 45% carbon monoxide (CO), 2% methane (CH4), and 4% nonfuel gases by volume. For biogas/landfill gas, a blend of 50% CH4, 45% CO2, and 5% nitrogen (N2) was used. From these blends, the CO2 potential can be calculated based on the stoichiometric combustion of the gas blends under standard conditions assuming that the volume percentages are analogous to molar percentages (ideal gas assumption). For any nondescript gas with no representative or standardized composition, this method cannot be used.
In the case where no heat rate data is available or an incompatible fuel is used, NETL has access to empirical data gathered from decades of gas turbine testing data from OEMs, which is summarized below in figure 1.
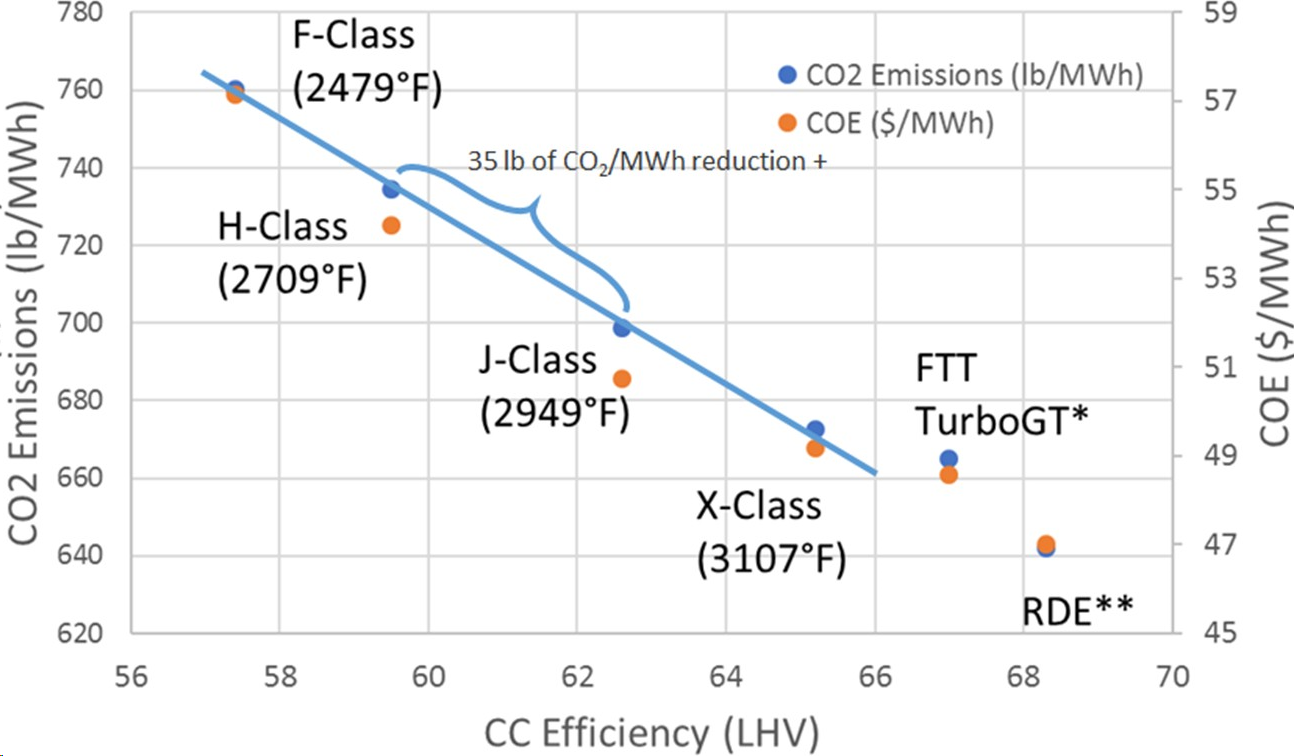
Figure 1 Turbine emissions correlated with turbine inlet temperature
From this chart, an equation may be generated for the CE using a linear approximation, as shown in equation 2:
\[ \textit{Carbon Efficiency (CE)} = \frac{-6}{47}(\textit{TIT}) + 1135.022 \]
Eq. 2
where the turbine inlet temperature (TIT) is in °R (degrees Rankine), yielding a number roughly between 650 and 800 lbs/MWh, which is somewhat more optimistic than the heat rate data calculation, which typically yields CEs in the 900-1200 lbs/MWh range.
Based on the CE and the capacity factor (CF), which is defined as the actual annual energy output compared to the maximum possible annual energy output assuming 100% full load operation year-round, the total emissions can be estimated, via equations 3 and 4:
\[ \textit{Capacity Factor (CF)} = \frac{\textit{Annual Plant Energy Output } \left(\tfrac{MWh}{year}\right)}{\textit{Rated Power Output (MW)} \times 8760\left(\tfrac{hrs}{year}\right)} \]
Eq. 3
\[ \textit{CO}_2 \textit{ Emissions} \left(\tfrac{tonnes}{year}\right) = \frac{\textit{CEF}\left(\tfrac{lbs}{MWh}\right) \times \textit{Rated Power Output (MW)} \times \textit{CF} \times 8760\left(\tfrac{hrs}{year}\right)}{2200 \times \left(\tfrac{lbs}{tonne}\right)} \]
Eq. 4
The CF was calculated using the monthly energy output information from the EIA-923 report. In cases where this data was not available, plant-level data from the same EIA-923 report was used to determine an overall plant CF and accompanying plant month-by-month energy graph. In cases where none of this data was available, a rough estimate of 85% CF was assumed. For the plant-level CE vs CF graph, both variables were calculated at the plant level by averaging the CE and CF values of individual units where available and weighting the terms by power output, as shown in equations 5 and 6. Localized (monthly, daily, etc.) CFs were calculated in a manner similar to equation 3, but with the power generated during the reference time frame in the numerator and the conversion factor of the number of hours in the given reference time frame.
\[ \textit{Power – Weighted Avg. Capacity Factor} = \frac{\sum \textit{CF}_i \textit{Power}_i}{\sum \textit{Power}_i} \]
Eq. 5
\[ \textit{Power} \;-\; \textit{Weighted Avg. Capacity Efficiency} = \frac{\sum \textit{CE}_i \textit{Power}_i}{\sum \textit{Power}_i} \]
Eq. 6
For the CO2 emissions, in cases where the CE could not be estimated due to lack of information on the TIT, a TIT was assigned based on the firing class, determined by figure 1. In all other cases, no calculations were made, and the CO2 emissions calculation process was skipped. For extremely small turbines (such as micro turbines), no calculations were made, as these were considered to be too far outside the available data range to accurately predict emissions via the aforementioned linear estimation scheme.
In some specific cases, the EIA dataset has information on plant-level energy output but not unit (turbine)-level energy output. In these cases, this plant-level data was used in the plots on the main map to show the month-by-month plant energy outputs for key plants where unit-level data was absent. Due to compatibility issues, this data was not used for the aggregated capacity factor plots on the dashboard; plants with no unit-level data available were thus omitted from these plots.
This dataset will be updated yearly based on new information from the EIA. New entries will be added based on the previously mentioned methodology. As new information becomes available for individual plants/installations, those entries will be updated with the most current information available. Any entries that cannot be verified via one of the aforementioned independent sources (including plant owners and independent news sources) will be ignored.


 Advanced Turbines Home