Business

Business
The goal of this project is to develop, build a prototype for, and test an efficient framework for processing and interpreting multi-component 3-D vertical seismic profiling (VSP) data.
Program
This project was funded through the Broad-Based Announcement DE-PS26-02NT41613, Research Area No. 2: Subsurface Imaging (Advanced Diagnostics and Imaging Systems, ADIS), issued onAugust 22, 2003. The objectives of Area 2 is to develop cutting-edge technologies to better find and produce petroleum.
Paulsson Geophysical Services
Brea, CA
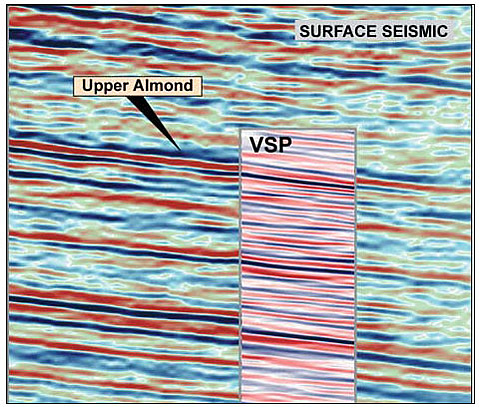
In oil and gas reservoirs, a large fraction of the total oil or gas volume may be bypassed using conventional imaging techniques. To estimate reservoir properties for field development and reservoir management, it is necessary to achieve greater resolution than 3-D surface seismic data can provide. 3-D VSP seismology fills the resolution and coverage gap between 3-D seismology that has lower resolution and well-logging techniques that have high resolution but only measure near-wellbore properties. Besides high resolution, VSP seismology has been proven to produce the best multi-component recordings of any seismic technique. Seismic signal component compressional (P) wave velocity information combined with shear (S) wave information provide detailed information on reservoir properties such as lithology, mechanical properties, pore volume, fracture volume, fracture directions, fracture widths, and type of pore fluids.
Project Results
The product of this research will be a commercially available multi-component 3-D VSP software tool that can be readily used for field development and reservoir management.
Benefits
The application of this processing and display software will lower the risk of drilling infill wells and deepening and recompleting existing wells by improving the understanding and delineation of reservoir properties. The software tool will allow processing and display of high-resolution images that can be used in the identification and subsequent production of bypassed oil and gas. The information generated will enable effective, economic reservoir management to increase recovery efficiency and can be used to outline drainage areas and identify flooding efficiency.
Project Summary
Paulsson Geophysical is developing a full-featured, fast, interactive 3-D multi-component processing and interpretation tool for VSP data. Existing pieces of processing software are being combined with novel display capabilities and a framework to perform complex processing tasks interwoven with the analysis and interpretation of 3-D multi-component VSP data.
The software both processes and interprets VSP data using a 3-D graphical user interface to drive the necessary processing and imaging algorithms. The software is being built to handle large data sets containing at least 1,000 receiver channels and several thousand source points. The software allows the use of auxiliary information, including well logs, formation tops, seismic ray path computations, and velocity models. The auxiliary information is combined with data and processing results to enable interactive model changes and quality control. The software runs on Linux as well as Windows XP operating systems.
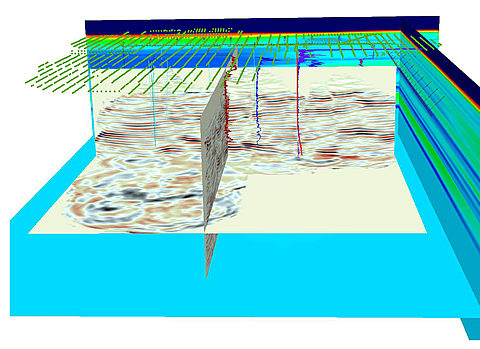
An interactive 3-D display is being developed that can display data such as well logs, P-S velocity model representations, rock properties, partially processed multi-component 3-D VSP seismic data slices and volumes, and other critical survey, geologic and field information.
The project has executed 4 of the 6 project phases. Phase 1 identified the data obtained from the San Andreas Fault Observatory at Depth (SAFOD) borehole to test the software being developed and generated synthetic 3-D borehole seismic data in various velocity models. In Phase II, the 3-D, three-component (3-C) display framework for the 3-D VSP data was designed and prototyped. Phase III entailed the design and prototype communication framework for low latency and high bandwidth. In Phase IV, the 3-D/3-C display framework interconnected with the parallel computing environment was designed, and the prototype was built.
(August 2005)
The prototype software has been tested using 3-D fault zone data from the SAFOD borehole. Interfaces of software libraries with newly designed 3-C displays have been improved. The project is continuing to design, implement, and test the basic data classes and software framework with emphasis on functionality tests and usability enhancements. In Phase V, reliability, speed, and usage tests on selected 3-D VSP data is to be conducted, and in Phase VI, the software is to be documented.
Publications
Paulsson, B., Karrenbach, M., Milligan, P., Goertz, A., and Hardin, A., High-Resolution 3-D Seismic Imaging Using 3-C Data From Large Downhole Seismic Arrays, First Break, V. 23, October 2004.
McGuire, D., Runyon, S., Williams, T., Paulsson, B., Goertz, A., and Karrenbach, M., Gas Hydrate Exploration with 3-D VSP Technology, North Slope, Alaska, 74th Ann. Internat. Mtg: Soc. Of Expl Geophys., 2004.
Karrenbach, et al., High-Resolution 3-D VSP Imaging, Seismic Reflection Workshop, Seeheim, Germany, 2004.
Paulsson, B., Karrenbach, M., Goertz, A., and Milligan, P., High-Resolution Fault Zone Monitoring and Imaging Using Long Borehole Arrays, American Geophysical Union meeting, 2004.
$1,032,980
$1,032,980 (50% of total)
NETL - Paul West (paul.west@netl.doe.gov or 918-699-2035
Paulsson - Martin Karrenbach (martin.karrenbach@paulson.com or 562-697-9711)