Business

Business
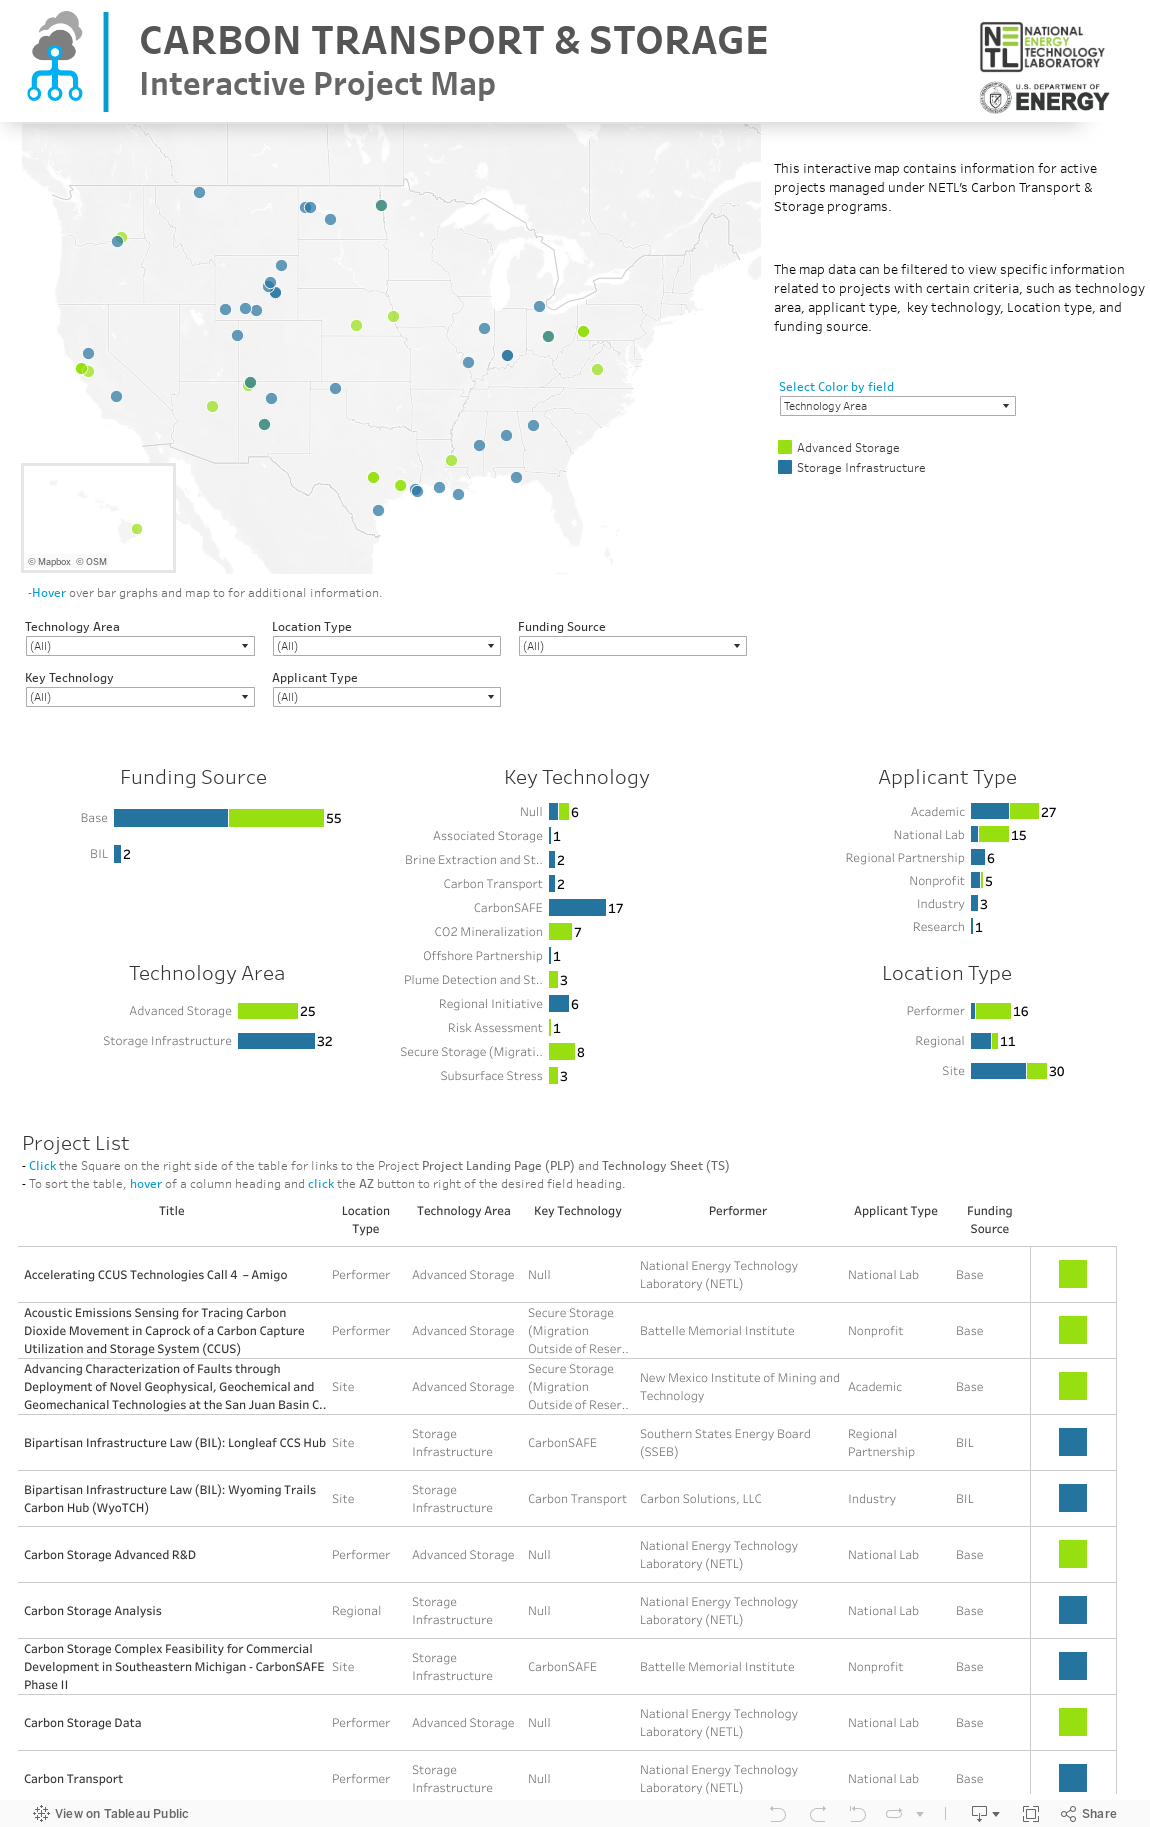
The National Energy Technology Laboratory (NETL) is supporting a diverse portfolio of projects, which can be viewed in the Tableau Dashboard below. This interactive map contains information for active projects managed under NETL’s Carbon Transport & Storage programs.
The map data can be filtered to view specific information related to project with certain criteria, such as technology area, applicant type, key technology, location type, and funding source.
Please note that the interactive map is best viewed using the Microsoft Edge internet browser.